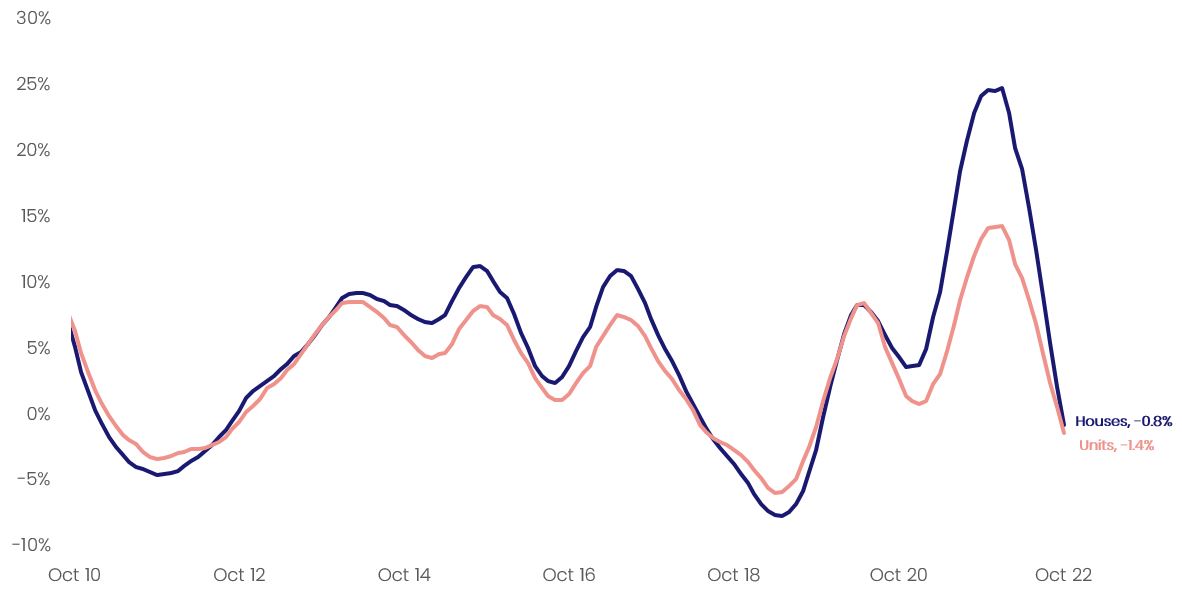
Continuing the trend seen over the past six months, CoreLogic's national unit value index declined by -0.8% in October, taking the median value to $598,417, -3.8% below the peak recorded in April .
This saw the annual growth trend for national unit values fall into negative territory for the first time in almost three years, with unit values now -1.4% below the level recorded this time last year. By comparison, national house values ($779,369) fell -1.3% over the month, taking house values -6.6% below the April peak and -0.8% lower over the 12 months to October.
CoreLogic Economist Kaytlin Ezzy said house values continue to be more sensitive to rising interest rates compared to units.
“As the larger monthly increases in house values recorded over the final quarter of last year fall out of the annual calculation, we'll likely see the annual growth trends intersect before the performance gap between house and unit values inverts in favour of units,“ she said.
As the downward phase of the cycle continues and falling values have become more widespread, the quarterly pace of decline has eased slightly. Across the combined capitals, the quarterly change in unit values has eased from a -2.7% decline in the September quarter to -2.4% over the three months to October.
"Several factors may have helped influence this deceleration," Ms Ezzy said. “Not least the smaller increases in the official cash rate between October and November, as well as a lack-luster spring selling season."
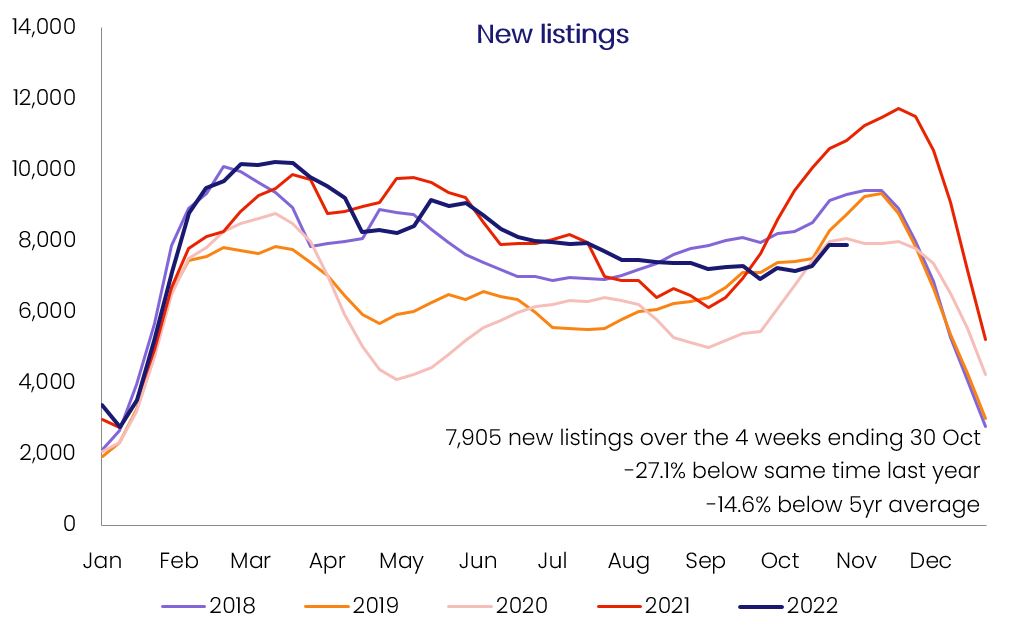
On average the flow of freshly advertised capital city unit listings surge by approximately 37.1% each year between the end of winter and the spring peak in October. However, in 2022, weaker selling conditions and lower vendor confidence saw the flow of fresh unit listings fell by -3.6% over the same period. This has helped to keep total advertised supply below the previous five-year average, despite a slowdown in buyer demand.
Figure 1 - Rolling annual growth rate, national houses and units
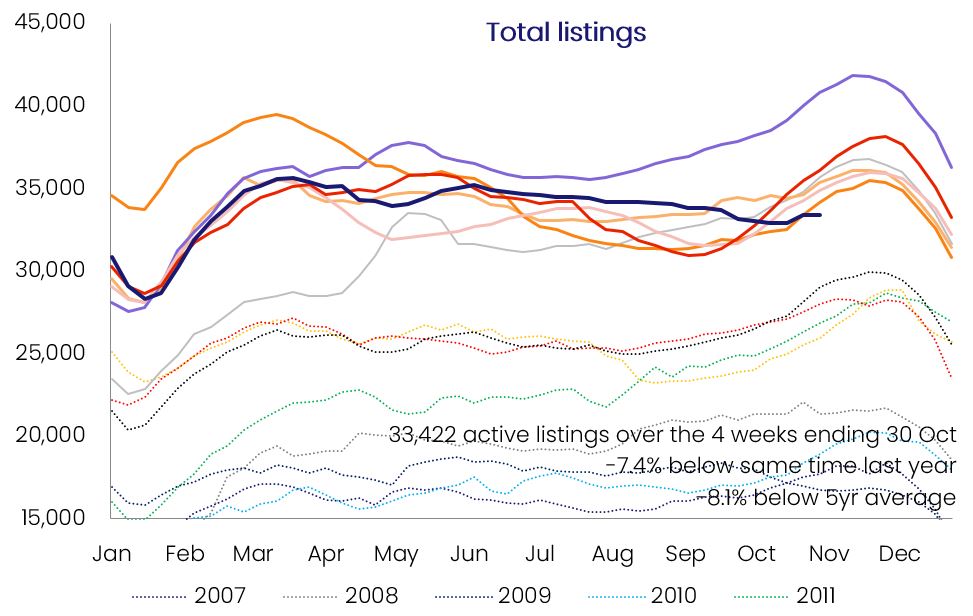
Over the four weeks to October 30th, newly advertised unit listings across the combined capitals were -14.6% below the previous five-year average, while total advertised supply was -8.1% below the average listings level for this time of year, indicating vendors were not dumping unit stock or rushing to exit the market, Ms Ezzy said.
“There has been no material increase in the number of distressed unit listings, in fact, total listings have remained fairly flat, with many prospective sellers choosing to wait for more favourable market conditions rather than sell during a downturn,“ she said.
Figure 2 – Four-week rolling count of new listings and total advertised listing - combined capital units
Unit values across Adelaide and Regional SA continue to be resilient to the current market conditions, recording monthly increases of 1.0% and 0.9%, respectively. At $239,856, Regional SA's median unit value is the cheapest amongst the greater capitals and rest of state regions, while the average unit in Adelaide ($436,462) in more than $150,000 cheaper than Melbourne ($597,533 ) and almost $350,000 cheaper than Sydney ($783,406).
"The current downturn has been fairly orderly so far, with declines first emerging in the most expensive markets before flowing through to the broad middle and more affordable markets,” Ms Ezzy said. “Given their relative affordability and below-average listing levels, it's unsurprising that SA's unit values are still increasing.However, the pace of growth across these markets has shown some signs of easing."
Other affordable unit markets, including Perth, Darwin, and Regional WA, recorded relatively mild value declines over the three months to October, down -0.1%, -0.5%, -0.9%, respectively. Brisbane recorded its first quarterly decline in two years, with unit values falling -1.2% over the three months to October.
“As the most affordable capital on the east coast, Brisbane's unit market had been more robust. However, six consecutive rate hikes, worsening affordability, and an easing in the South East Queensland migration trend have weakened demand,” Ms Ezzy noted. Regional Queensland recorded a larger quarterly decline in unit values (-2.9%) thanks to a stronger decline across the Gold and Sunshine Coasts (down -2.9% and -6.0%, respectively).
At the other end of the scale, Regional Tasmania units recorded the strongest decline in unit values, with the quarterly growth rate remaining steady at -7.8% for the second consecutive month. This was followed by units across Hobart (-4.2%) and Sydney (-3.3%), which both recorded a deceleration in the quarterly rate of decline, down from -5.3% and -3.9%, respectively, over the three months to September.
For more analysis, graphs and charts download the full November Unit Market Update.

Meet Kaytlin Ezzy
Economist
Kaytlin Ezzy is an Economist at CoreLogic, Australia’s leading property data, information, analytics and services provider.
Full profile