National house values rose 32.5% between September 2020 and April 2022, while national unit values rose by a milder 16.1% over the same period.
Throughout the pandemic period, a shift in consumer preferences towards more space along with overseas migration dropping sharply into negative territory, saw housing value growth skew towards the low-density sector. National house values rose 32.5% between September 2020 and April 2022, while national unit values rose by a milder 16.1% over the same period. Since peaking in April, house values are now reversing at a more rapid rate, falling -5.3%, while values across the medium to high-density sector have declined by a more moderate -3.0%.
Figure 1 shows the rolling 12-month change in national house and unit values. The steeper decline in house values has seen the annual performance gap between national house and unit values narrow to just 1.6 percentage points in September, with houses up 2.1% over the past 12 months, while unit values are just 0.5% above the levels recorded this time last year.
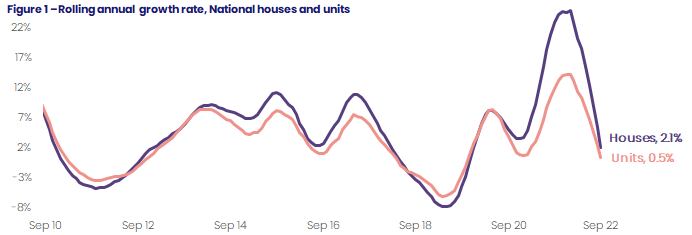
CoreLogic Economist Kaytlin Ezzy said “As we move further into the downwards phase of the cycle, and the annual trend approaches negative territory, it's likely the annual performance gap will begin to widen in the other direction, with unit values being more resilient to affordability constraints and rising interest rates.”
The downwards trend in unit values was generally confined to the upper quartile of the market through the first few months of the down phase, however, the more recent trend has seen value declines become more geographically widespread as declines spread to the middle and lower quartile of the unit market. Figure 2 shows the three-month rolling change in capital city unit values across the different value segments. While values across the more expensive upper quartile have been recording quarterly declines for the past few months, consecutive rate hikes and record-high household debt-to-income levels have seen declines spread to each of the broad value segments.
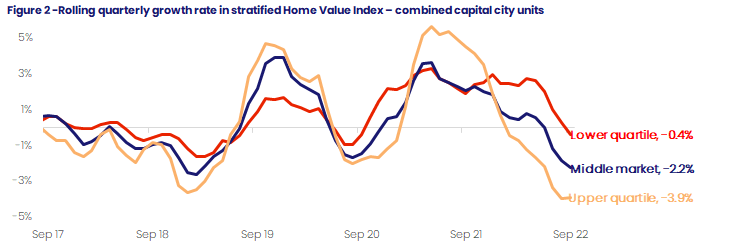
“Capital city unit values across the middle of the market fell -2.2% over the September quarter, while the quarterly change in unit values across the more affordable lower quartile fell into negative territory in September, declining -0.4% over the past three months,” said Ms Ezzy.
A similar trend has been observed more granularly in CoreLogic’s Q3 Mapping the Market report, which analyses house and unit values at the suburb level. Across the capitals, 70.8% of the 982 unit markets analysed declined over the September quarter, up from 39.8% over the June quarter. While some of the more affordable capitals such as Adelaide (11.6%) and Perth (38.9%) saw a smaller portion of unit markets decline over the quarter, the majority of suburbs across Hobart (100%), Sydney (95.7%), Melbourne (88.4%) and Canberra (85.1%) recorded quarterly falls.
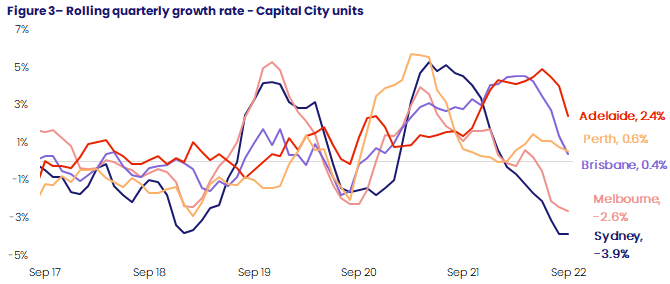
Though combined capital unit values fell by -0.8% in September (taking them -2.7% lower over the quarter), monthly value change across the individual capitals ranged from a -1.1% decline across Hobart, to a 0.1% rise in Adelaide.
“Adelaide’s relative affordability, coupled with low advertised stock levels, has seen Adelaide’s unit market remain resilient to declining values. While monthly growth remains positive, the pace of growth has slowed significantly. With further interest rate rises expected in the coming months, it’s likely Adelaide’s unit market will soon find its peak, before declining.”
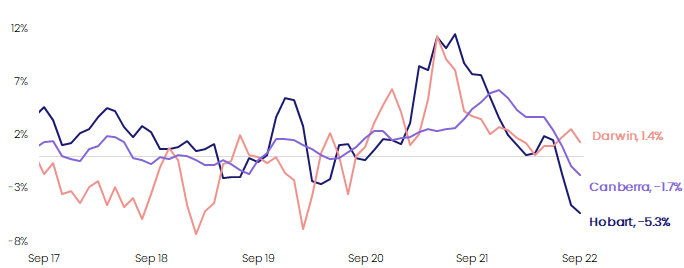
A later cyclical peak in values across the more affordable capitals has seen unit values across Brisbane (0.4%), Perth (0.6%) and Darwin (1.4%) increase over the quarter, despite values falling on a monthly basis in September (down -0.1%, -0.1% and -0.3% respectively).
At the other end of the scale, Hobart’s monthly decline of -1.1% saw unit values slip -0.1% below the levels recorded this time last year, while the -1.0% and -0.8% monthly declines seen across Sydney and Melbourne took the annual change to -4.8% and -1.6% respectively.
Unit values across the combined regional markets also fell -0.7% over the month, with only Regional SA (1.2%) and Regional WA (1.3%) recording a rise in unit values.
After lower demand saw capital city unit listings trend higher over winter, a late start to the spring selling season has seen total advertised unit supply fall to -2.7% below the previous five-year average, over the four weeks to October 2nd.
“While the flow of newly advertised listings typically falls through winter, it is generally followed by a bump of around 20% in spring. However, it appears the spring selling season is off to a slow start this year, with freshly advertised unit listings -14.8% below the number seen this time last year and -4.4% below the previous five-year average,” said Ms Ezzy. “It seems prospective vendors are looking to wait out the current downturn, rather than trying to sell under unfavourable selling conditions.”
National unit rents continue to surge, up 1.1% in September, compared to a 0.5% rent rise seen across houses. While there are some early signs the pace of rental growth has started to slow, with the quarterly trend recording a cyclical peak of 3.7% in July before easing to 3.5% in September, the annual trend recorded a new record high, with unit rents rising 11.8% over the 12 months to September.
Except for Canberra (-0.1%) and Regional Tasmania (-0.3%), each capital city and regional unit market saw rents rise in September. Brisbane continues to record the strongest monthly increases in rental values, up 1.4% (taking rents 4.6% higher over the three months to September), followed by Sydney and Adelaide which both saw rents rise 1.3% over the month. Over September, unit rental values rose by 1.2% across Regional WA and Regional SA, by 1.0% across Melbourne and Darwin and by 0.9% across Hobart and Regional Queensland.
"While the sustained period of rental growth has seen an increasing portion of tenants encounter affordability challenges, given the relative affordability of unit rents compared with house rents, coupled with the strong return of overseas migration and record low rental vacancy rates (1.1% across both the combined capitals and combined regions) we'll likely see rental growth remain strong for some time yet."
With rental growth continuing to outpace capital gains, gross rental yields for units nationally rose an additional 8 basis points over September, taking gross yields 49 basis points above the record lows recorded in December 2021 (3.66%). Yields rose across each of the capital cities and rest of state unit markets, with the exception of Regional SA and Regional Tasmania, where yields fell two and five basis points respectively. Despite rising 57 basis points above the yields recorded this time last year, Sydney (3.61%) continues to return the lowest gross rental yield across the capitals, followed by Melbourne (3.98%), Hobart (4.35%) and Brisbane (4.91%). A closer look at rental performance across the September quarter is available in CoreLogic’s Quarterly Rental Review.
The outlook for unit values remains linked to the trajectory of interest rates. With interest rates expected to rise further, it is unlikely unit values will find their floor until interest rates stabilise. While falling values have potentially helped some first home buyers clear the deposit hurdle, with the cash rate now 2.5 percentage points above the emergency low rates seen in April (0.10%), the conversation around affordability is shifting towards mortgage serviceability.
“Despite median unit values across Australia falling by around $19,000 since April, the typical monthly mortgage repayment on a new owner-occupier loan is now approximately $600* higher than before the first rate rise,“ said Ms Ezzy.
“However, there are some possible tailwinds on the horizon. The pace of monthly unit value declines eased slightly in September, from a -0.9% fall recorded in July and August, to -0.7% in September. While still early days, this could be a sign that unit values are passing their peak rate of decline.
“Additionally, the pace of interest rate rises has also started to slow, with the RBA announcing a 25 basis point rise in October, suggesting that the tightening cycle could be shorter than previously expected.”

Meet Kaytlin Ezzy
Economist
Kaytlin Ezzy is an Economist at CoreLogic, Australia’s leading property data, information, analytics and services provider.
Full profile