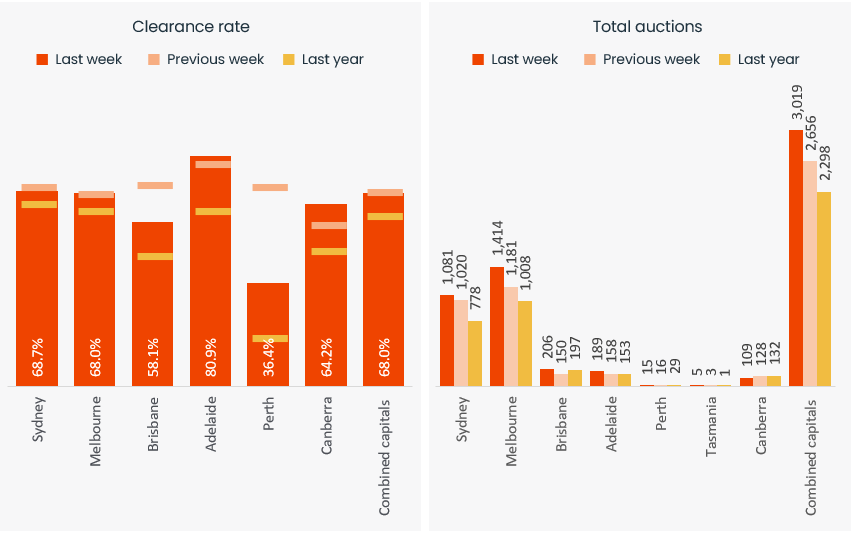
With 3,019 auctions held last week, the combined capitals hosted the second busiest auction week of the year-to-date. Exceeding the 3,000 mark for only the second time this year, volumes were up 13.7% compared to the week prior (2,656) and 31.4% higher than this time last year (2,298).
The rise in auction numbers was accompanied by a drop in the preliminary clearance rate. At 68.0%, with 2,262 records collected so far, last week's combined capital city preliminary clearance rate was the lowest since Easter (67.8%). The dip was primarily driven by vendors, with the combined capital's withdrawal rate rising to 10.9%, while the portion of properties passed in at auction fell to 21.2%. The previous week's preliminary clearance rate was one percentage point higher at 69.0% (revised to 63.1% once finalised), while 60.2% of auctions held this time last year were successful.
Capital City Auction Statistics (Preliminary)
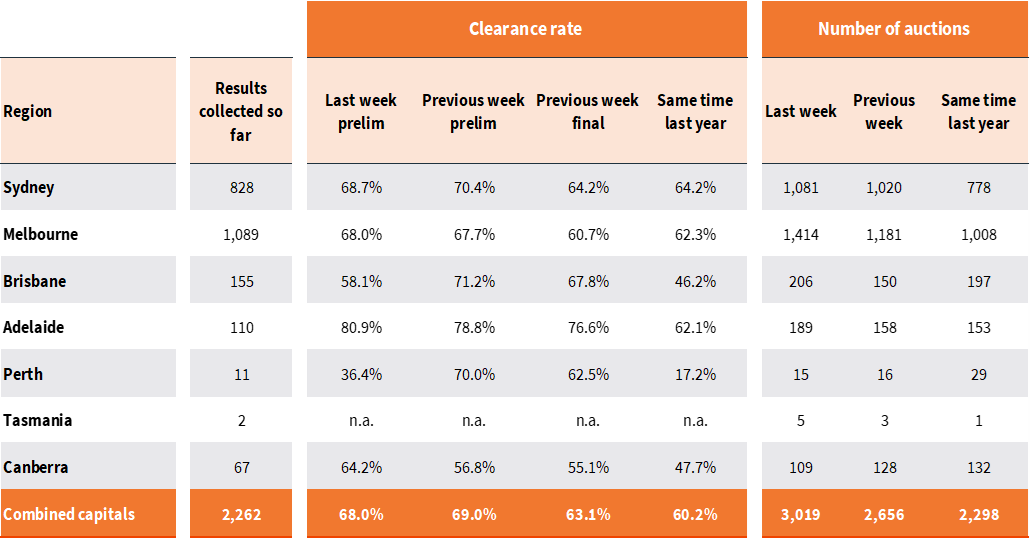
Across Melbourne, 1,414 homes went to auction last week, up 19.7% from the 1,181 held the week prior. The second busiest auction week of the year so far, behind the week ending 29th October (1,725), last week's numbers were 40.3% higher than this time last year (1,008). While in line with the combined capital's result, Melbourne's preliminary clearance rate (68.0%) rose 30 basis points, with 1,089 results collected so far. The previous week's preliminary clearance rate of 67.7% was revised to 60.7% at final figures, while this week last year, 62.3% of auctions reported a successful result.
Sydney hosted its busiest auction week in almost 18 months, with 1,081 homes taken under the hammer last week. Up from the 1,020 auctioned the week prior and 778 held this time last year, last week's numbers were the city's highest since late May 2022 (1,109). At 68.7%, with 828 results collected so far, Sydney's preliminary clearance rate fell below 70% for the first time in six weeks. Last week's result was the city's lowest preliminary rate since mid-February (67.4%) and was 1.7 percentage points below the previous week's preliminary rate (70.4%). The previous week's revised numbers were in line with the final results recorded this time last year when 64.2% of auctions were successful.
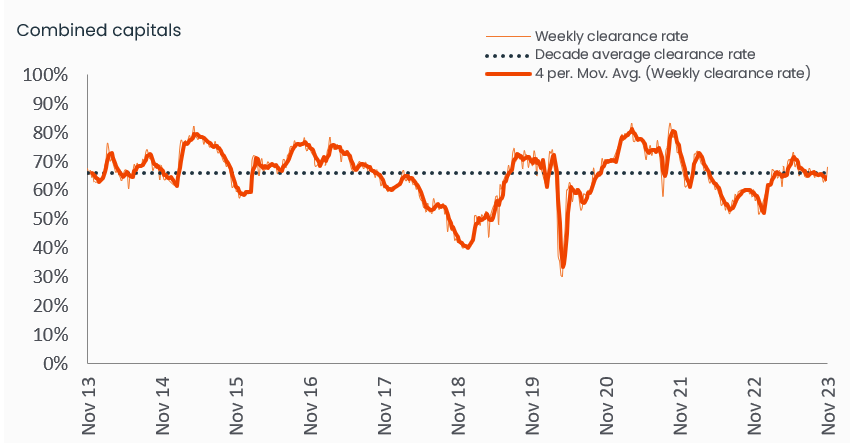
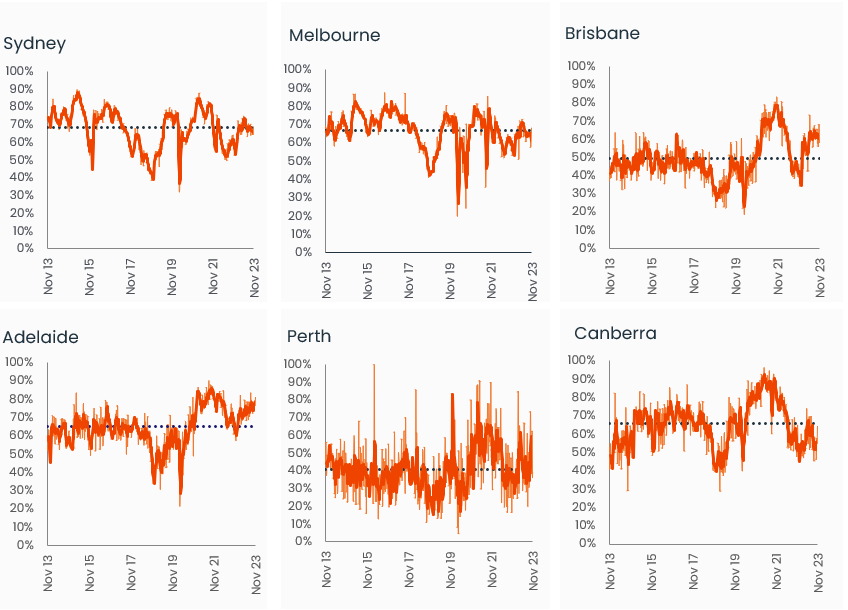
Capital City Auction Statistics over time
Historical clearance rates utilise the final auction clearance rate, while the current week is based on the preliminary clearance rate.
Across the smaller capitals, Brisbane hosted the busiest auction market last week (+37.3%), with 206 homes taken under the hammer across the city. This was followed by Adelaide, which recorded its busiest auction week of the year, with 189 homes auctioned, up 19.6% week-on-week. Canberra (109) and Perth (15) were the only capitals to see a fall in auction activity, down -14.8% and -6.3%, respectively. Adelaide's preliminary clearance rate rose back above the 80% mark, with 80.9% of auctions returning a successful result, while Canberra's preliminary clearance rate came in 7.4 percentage points higher at 64.2%. Across Brisbane, 58.1% of auctions were successful, down -13.1 percentage points week-on-week, while just four auctions in Perth have recorded positive results so far. None of the five auctions held in Tasmania have returned successful results.
As we approach the peak in seasonal activity, auction numbers are set to rise slightly this week, with around 3,100 auctions currently scheduled to be held across the capital. With more than 1,000 auctions scheduled for both Sydney and Melbourne, this week will provide a timely test of the market's depth of demand.
Capital City Auction Statistics (Preliminary)
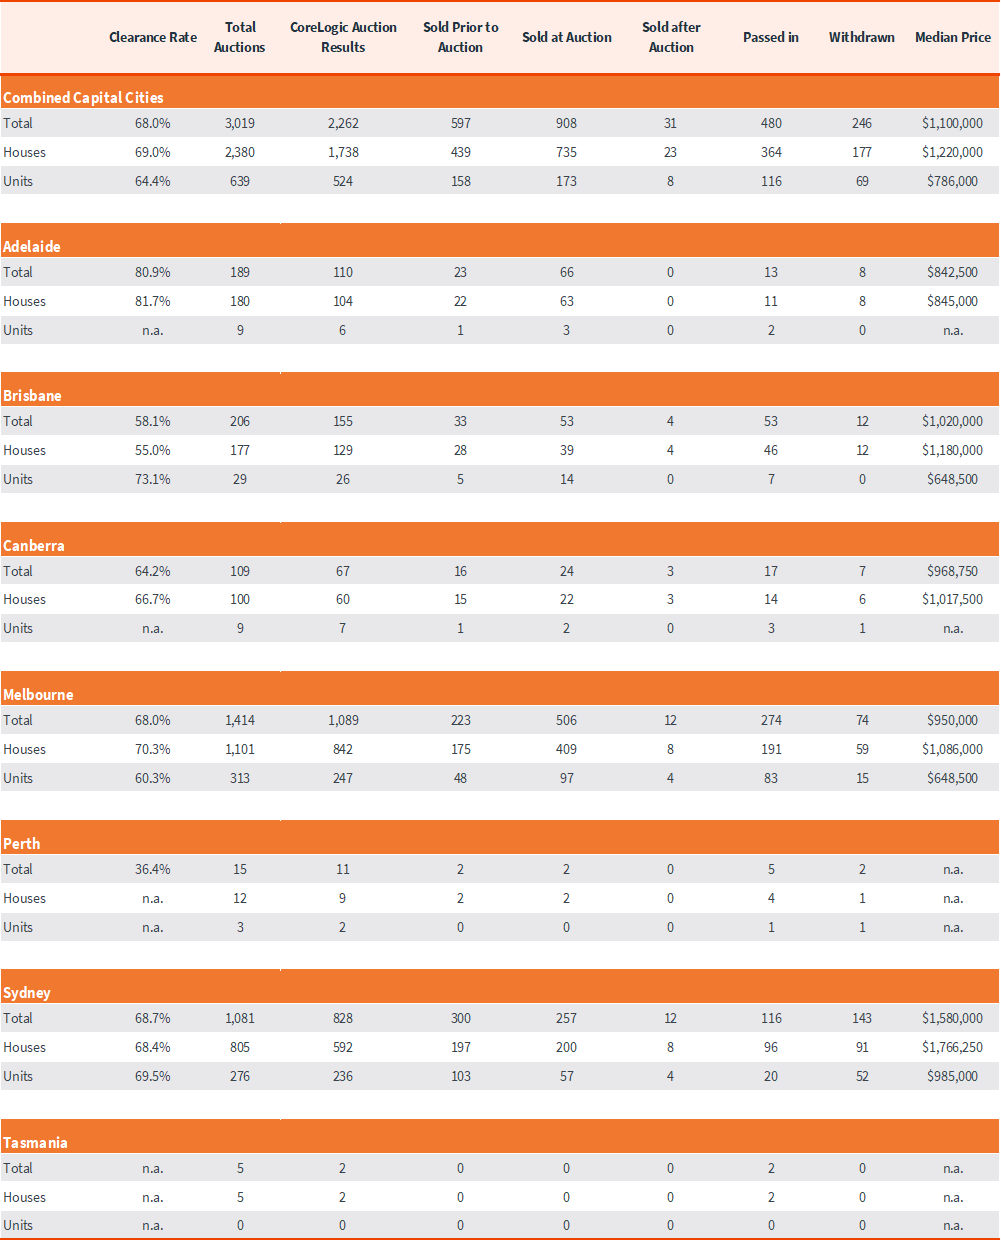
The above results are preliminary, with ‘final’ auction clearance rates published each Thursday. CoreLogic, on average, collects 99% of auction results each week. Clearance rates are calculated across properties that have been taken to auction over the past week.
Sub-region auction statistics (preliminary)
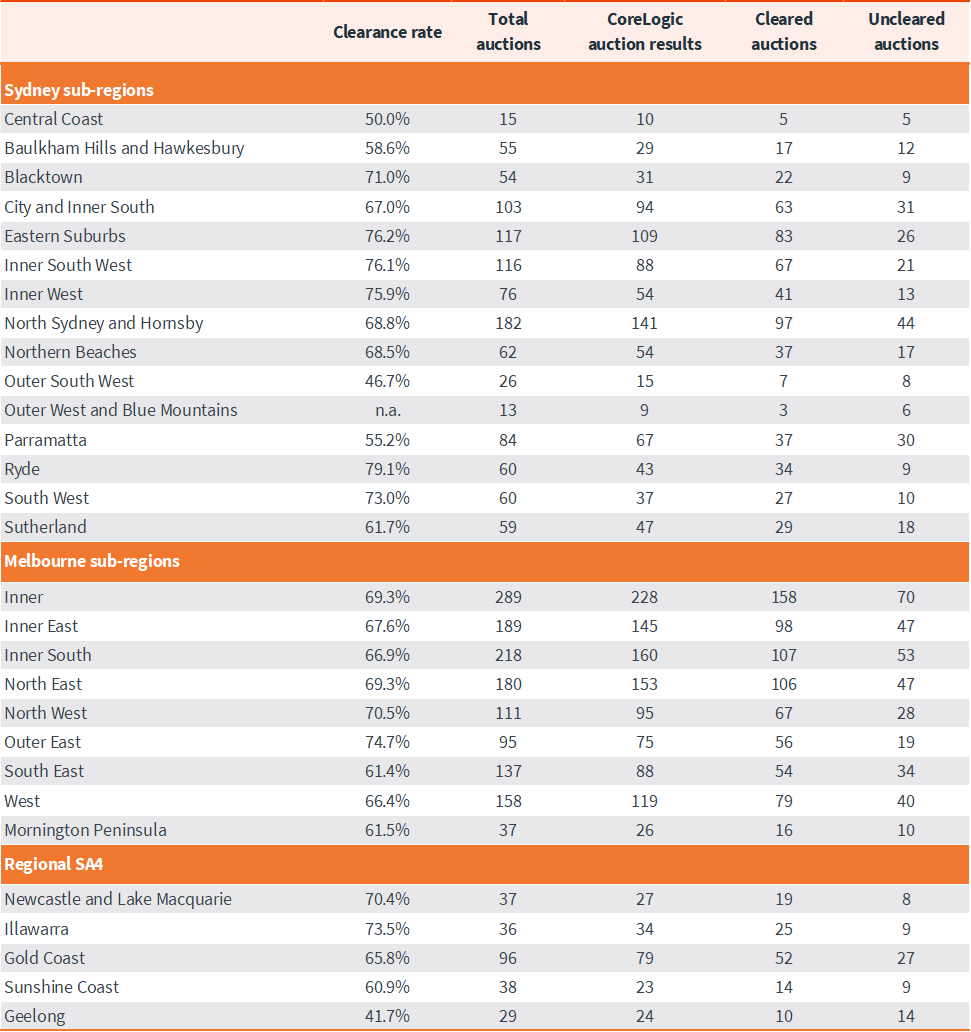
CoreLogic, on average, collects 99% of auction results each week. Clearance rates are calculated across properties that have been taken to auction over the past week.
Download Property Market Indicator Summary
