The combined capitals preliminary auction clearance rate nudged a little higher last week, reaching 71.4%, the highest early clearance rate since the last week of July. The result was 70 basis points higher than the previous week (70.7%), which later revised down to 64.8%.
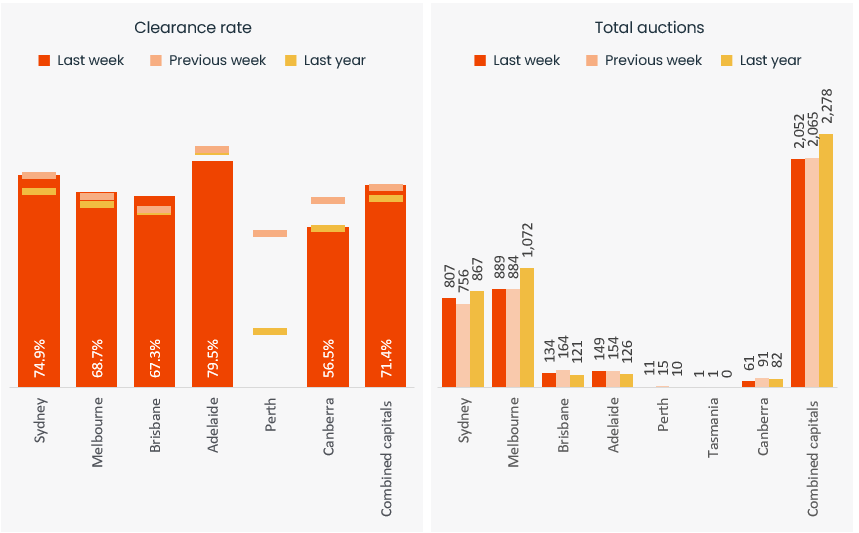
The volume of capital city auctions has been rising, with 2,052 homes going under the hammer last week. Although the number of auctions is down on the same time last year (2,278), it’s clear that auction activity is warming up as we approach spring.
Capital City Auction Statistics (Preliminary) – headline results
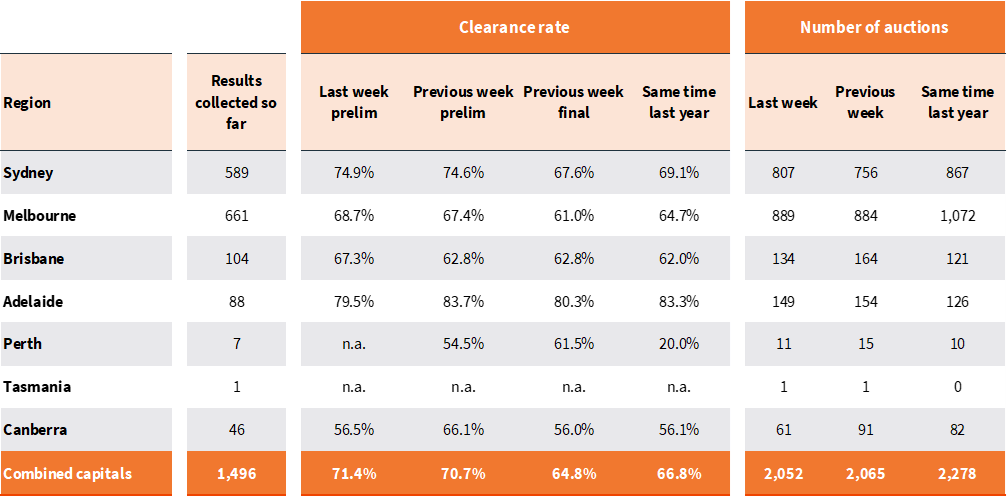
Both of the major auction markets contributed to the stronger result, with Melbourne hosting 889 auctions to return a preliminary clearance rate of 68.7% (up from 67.4% a week ago which revised down to 61.0% on final numbers). Sydney hosted 807 auctions with a preliminary clearance rate of 74.9%, marginally above the previous week’s result of 74.6% (revised down to 67.6% on final numbers).
Capital City Auction Statistics over time
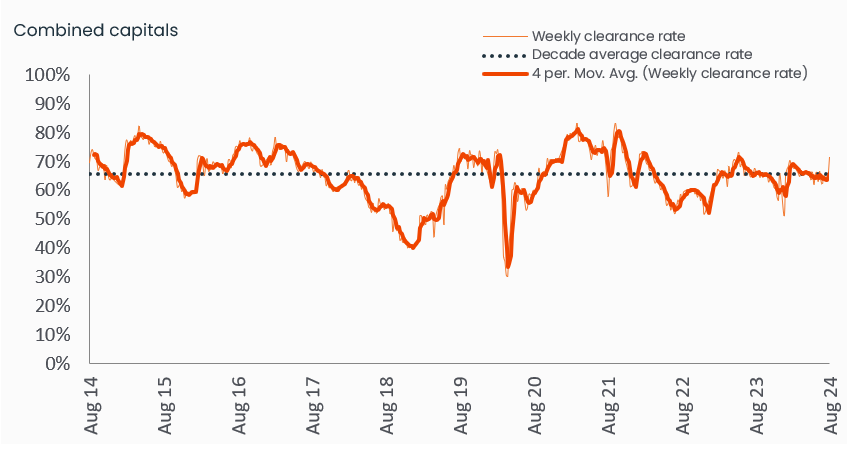

Historical clearance rates utilise the final auction clearance rate, while the current week is based on the preliminary clearance rate.
The smaller auction markets are showing a consistent pattern, with Adelaide leading the clearance rate at 79.5%, followed by Brisbane at 67.3% and Canberra at 56.5%.
With the flow of fresh listings, including auctions, trending higher, the depth of market demand will be tested over the coming weeks and months. This week we are expecting around 2,300 auctions to be held with the volume of auctions likely to rise more substantially into spring and early summer.
Capital City Auction Statistics (Preliminary)
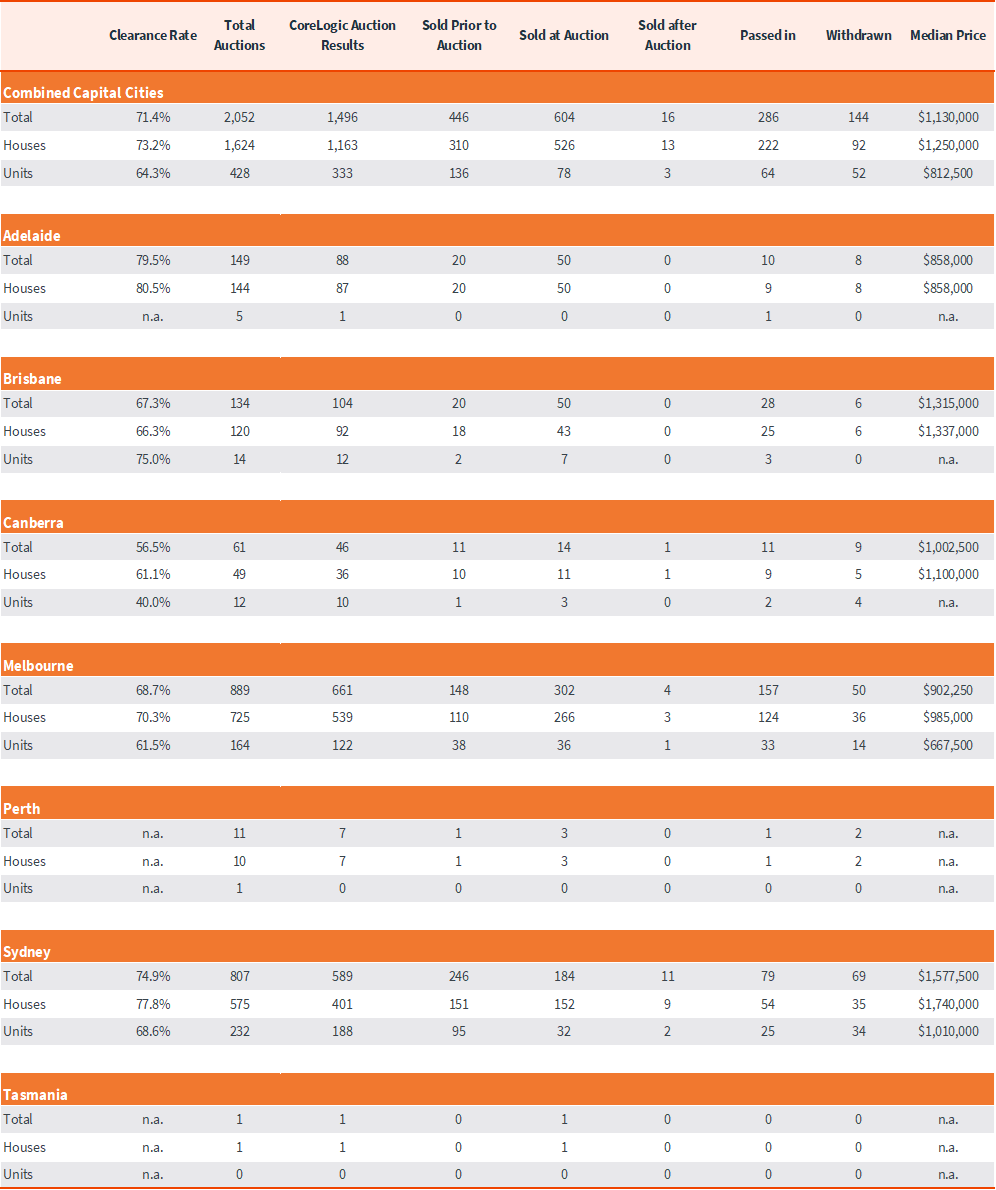
The above results are preliminary, with ‘final’ auction clearance rates published each Thursday. CoreLogic, on average, collects 99% of auction results each week. Clearance rates are calculated across properties that have been taken to auction over the past week.
Sub-region auction statistics (preliminary)
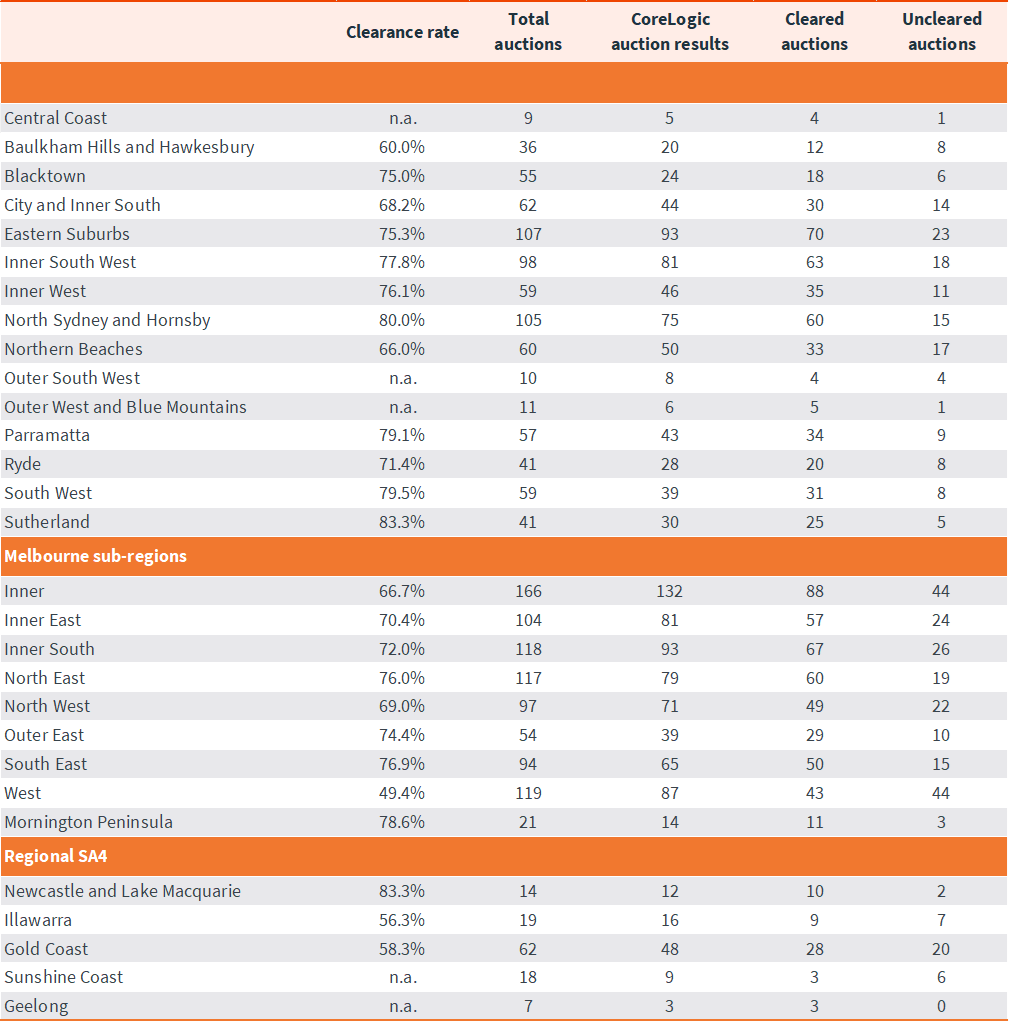
CoreLogic, on average, collects 99% of auction results each week. Clearance rates are calculated across properties that have been taken to auction over the past week.
Download Property Market Indicator Summary

Meet Caitlin Fono
Sr Associate, Research Support
Caitlin has spent more than a decade working with property data and analytics in various roles, earning a position on the CoreLogic research team in 2013. As a respected and highly experienced research analyst, Caitlin works with high frequency data sets, regularly updating our widely read auction reporting, weekly activity updates and customised data briefs.
Full profile