In today’s Pulse article, Research Director Tim Lawless examines the driving forces behind Melbourne falling behind Adelaide and Perth in terms of median dwelling value, as housing values across Australia's capital cities go through a changing of the guards.
The housing value league tables have evolved significantly over recent years. At the onset of COVID in March 2020, Sydney had the highest median dwelling value, followed by Melbourne, the ACT and Brisbane. Perth was ranked 7th in terms of median dwelling value, after Darwin with the lowest median, followed by Adelaide.
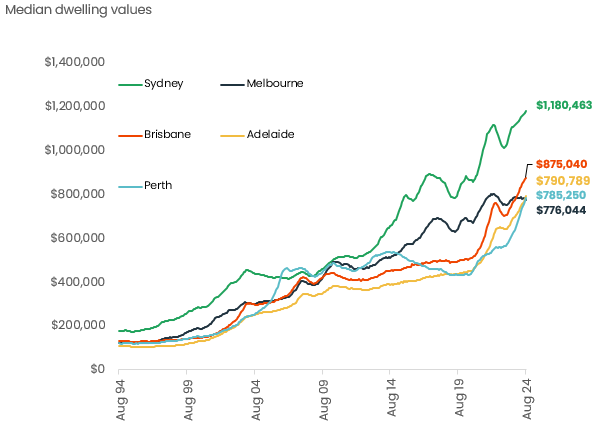
Fast forward to August 2024, and Melbourne’s median dwelling value, at $776k is ranked sixth lowest across the eight capital cities, after Darwin ($504k) and Hobart ($655k). The difference between Sydney and Melbourne’s median dwelling value is now 52.1%, the largest differential between Australia’s two largest capitals since June 1999.
Sydney continues to record the most expensive median dwelling value at $1.18 million, but the gap between Sydney and the mid-sized capitals has narrowed substantially. Sydney’s median is ‘only’ 35% higher than Brisbane’s, the narrowest difference since July 2013, the 49% premium over Adelaide’s median is the narrowest since May 2013 and the 50.3% premium of Perth’s median hasn’t been this narrow since June 2015.
The changing hierarchy of housing values across Australia’s capital cities is attributable to both the speed of change in home values as well as the composition of housing.
Speed of change
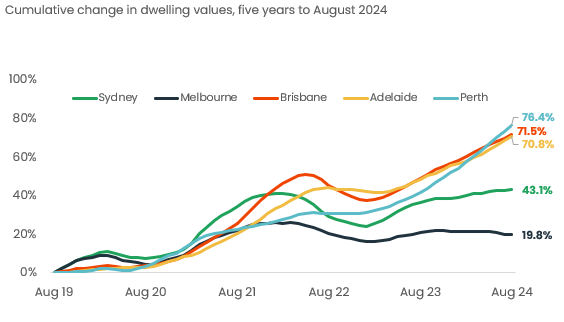
The past five years has seen national dwelling values rise by 47.9%, but with extreme diversity from city to city. Perth has led the pace of gains with a stunning 76.4% rise in values since August 2019, Brisbane values are up 71.5% and Adelaide has surged by 70.8%. At the other end of the spectrum is Melbourne where values are up ‘only’ 19.8% and Sydney values have risen by 43.1%.
Such a rapid pace of growth in housing values across the mid-sized capitals has been a key factor driving the shift in median dwelling value rankings.
The past 12 months has seen a continuation in this diversity of housing conditions, with the 25.6 percentage point range in annual growth rates across the capital cities now the widest since the height of the mining boom in 2006.
There are a few factors that have contributed to different speeds of change across the capital cities since the start of the pandemic, including;
Demographic patterns: marked differences in net interstate migration trends, where strict, extended social distancing restrictions were a ‘push’ factor from Melbourne, while Brisbane, Perth and Adelaide likely benefitted from Melbourne departures. SA and WA saw net interstate migration trends move into positive territory through the pandemic for the first time in many years. The latest internal migration data to the end of 2023 showed net interstate migration to Victoria was still in negative territory, albeit mildly, while NSW, TAS, NT and ACT were all fairly negative.
New housing supply is another aspect driving divergence in the growth trend, with Victoria seeing far more dwelling completions than any other state or territory in the past decade, and ACT seeing an ongoing trend of elevated unit completions.
Housing affordability was far less stretched across the mid-sized capitals leading into the pandemic due to a prolonged period where values didn’t rise any where near as much as Sydney and Melbourne over the previous growth cycle.
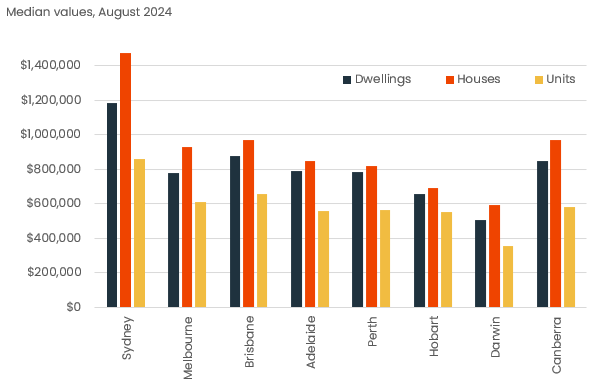
Composition of housing. A key factor in the median dwelling value of Perth and Adelaide overtaking Melbourne is the underlying mix of housing types. The median dwelling value measures the 50th percentile valuation estimate of all houses and units combined.
Importantly, when we measure the median house and unit value separately, Melbourne is still showing a higher median across both housing types than Perth and Adelaide.
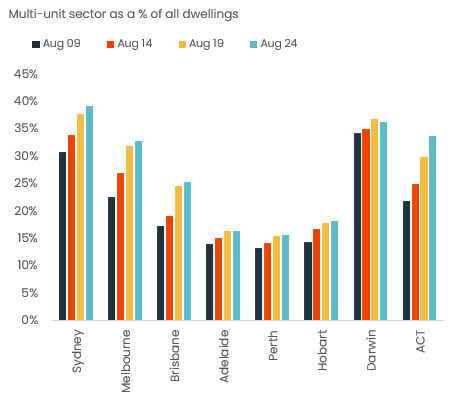
The difference comes back to the composition of dwellings and the fact that Melbourne has densified more substantially and rapidly than the mid-sized capitals. In August, CoreLogic estimates a third (33%) of housing stock in Melbourne falls within the multi-unit sector, compared with 25% in Brisbane and 16% of housing stock in Adelaide and Perth.
Considering unit values are generally much lower than house values, the higher portion of multi-unit dwellings in Melbourne tends to weigh the median dwelling value down relative to cities with a skew towards lower density styles of housing.
There hasn’t been much progress in densification across Perth or Adelaide. Over the past fifteen years, the composition of Perth dwellings moved from 13% within the multi-unit sector to 16%. Similarly, Adelaide moved from 14% to 16%. Over the same time frame, Melbourne’s multi-unit sector has increased from 23% of all housing to 33% and Sydney has increased from 31% to 39%.
Hobart, where 18% of dwellings fall within the multi-unit sector, and Darwin (36% multi-unit) have a larger portion of medium to high density dwellings than Perth and Adelaide.
The compositional difference in housing types between the capitals is a clear factor influencing the median dwelling value as well as measures of housing affordability.
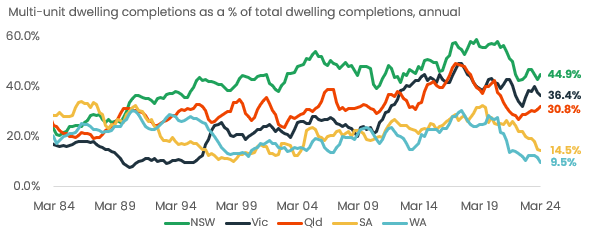
Annual dwelling completions data shows this trend perpetuating, with the multi-unit sector across WA and SA comprising just 9.5% and 14.5% of all dwelling completions over the 12 months to March 2024, less than half the national average of 33.8% and well below the portion of multi-unit sector completions across every other capital city.
As affordability becomes more stretched and state governments shy away from the expense associated with sprawling infrastructure commitments required to maintain a geographically distributed population, we are likely to see some renewed focus on establishing higher densities in Perth and Adelaide.

Meet Tim Lawless
Executive, Research Director, Asia-Pacific
Tim is executive research director of CoreLogic’s Asia–Pacific research division, managing a team of economic and data specialists across Australia and New Zealand. He brings more than 20 years’ experience to the role, providing deep insights and analysis on national housing trends.
Full profile