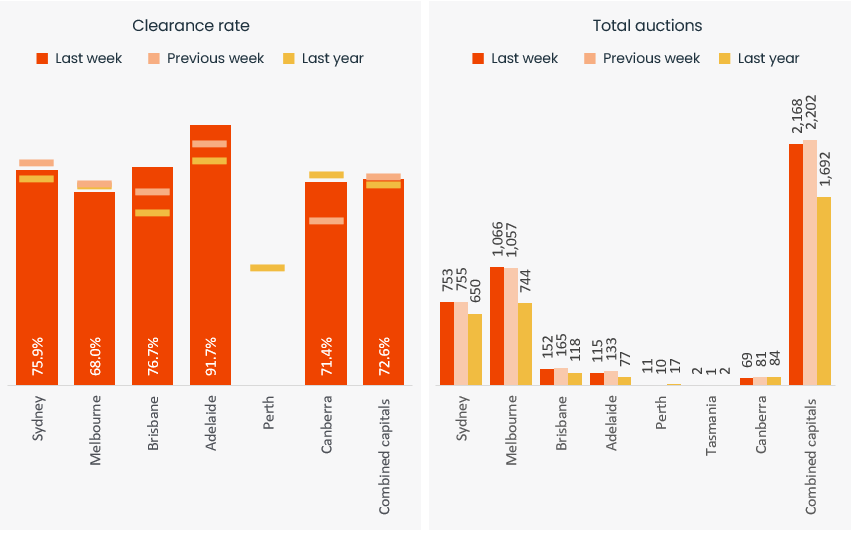
The volume of capital city auctions remained above the 2,000 mark for the second week running, with 2,168 properties going under the hammer last week. The number of auctions was down 1.5% on the previous week (2,202) but 28% higher than at the same time last year (1,692).
The preliminary clearance rate, at 72.6%, was the lowest since the Easter long weekend with the largest auction markets weighing on the early result. Sydney’s preliminary clearance rate fell from 78.1% over the previous week to 75.9% and Melbourne’s preliminary clearance rate fell from 71.0% to 68.0%.
Capital City Auction Statistics (Preliminary)
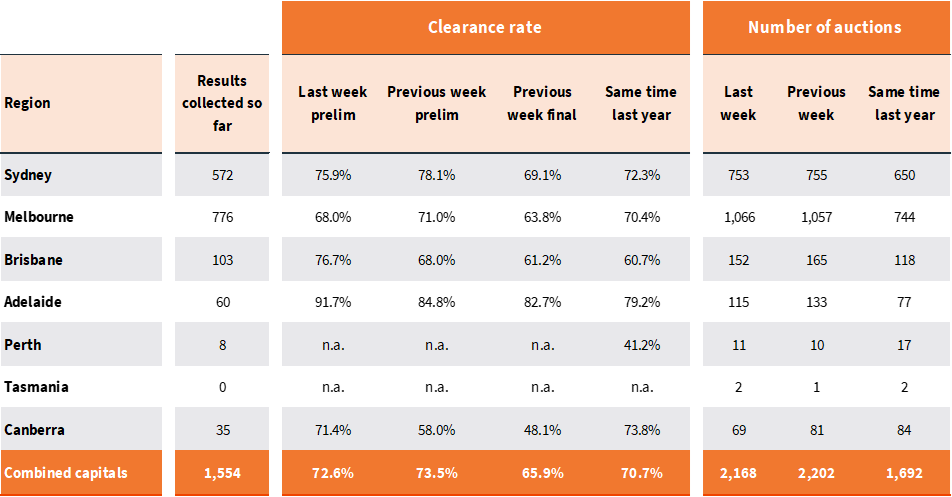
The smaller auction markets strengthened, with Adelaide’s preliminary clearance rate rising to 91.7% (second highest result so far this year), Brisbane’s early clearance rate rose to 76.7% and Canberra broke the 70% mark (71.4%) for the first time since the week before Easter.
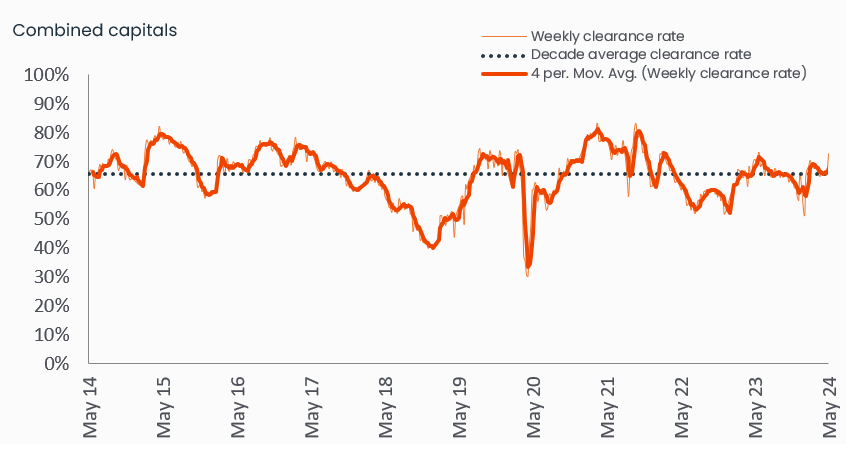
Finalised auction clearance rates have faded a little from earlier in the year, holding roughly around the decade average of 65.1% (the previous week saw a finalised clearance rate of 65.9%). With the average revision between the preliminary and finalised capital city clearance rate tracking at 7.5 percentage points, we are likely to see last week’s final clearance rate once again in line with the long run average.
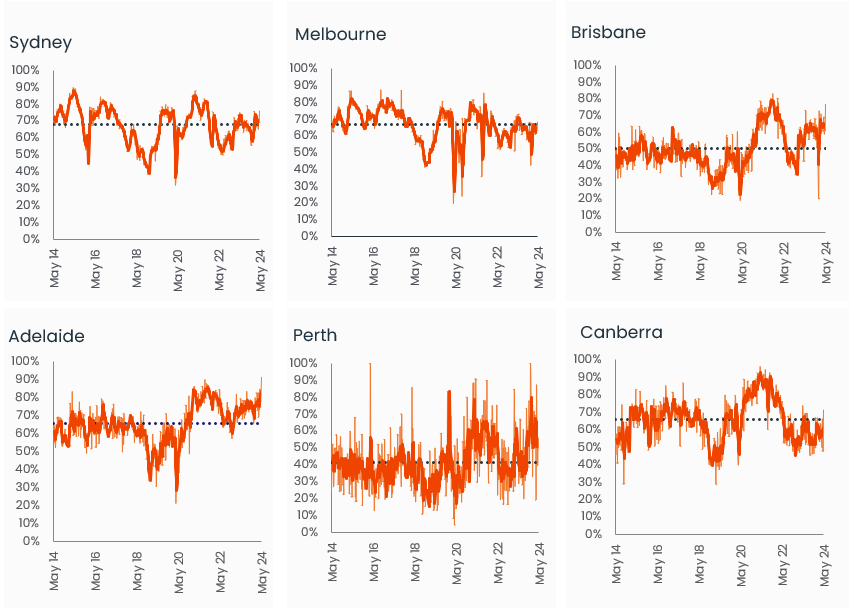
Capital City Auction Statistics over time
Historical clearance rates utilise the final auction clearance rate, while the current week is based on the preliminary clearance rate.
We are expecting another 2,000+ week of auctions this week, with around 2,100 homes currently scheduled to go under the hammer. More broadly, the trend in new capital city listings has also picked up a little with the flow of freshly advertised stock coming to market tracking almost 17% higher than at the same time last year and 12.7% above the previous five-year average. Despite the rise in fresh listings, total advertised inventory is holding firm to be 4.0% lower than a year ago and 16.3% below the previous five-year average.
CoreLogic’s daily home value index is continuing to rise at the same pace as recorded through April with values up 0.6% over the past four weeks, although the trends remain diverse from city to city with Melbourne nudging back into negative monthly change (-0.1%) while Perth values continue to surge higher, up 1.8% over the past four weeks.
Capital City Auction Statistics (Preliminary)
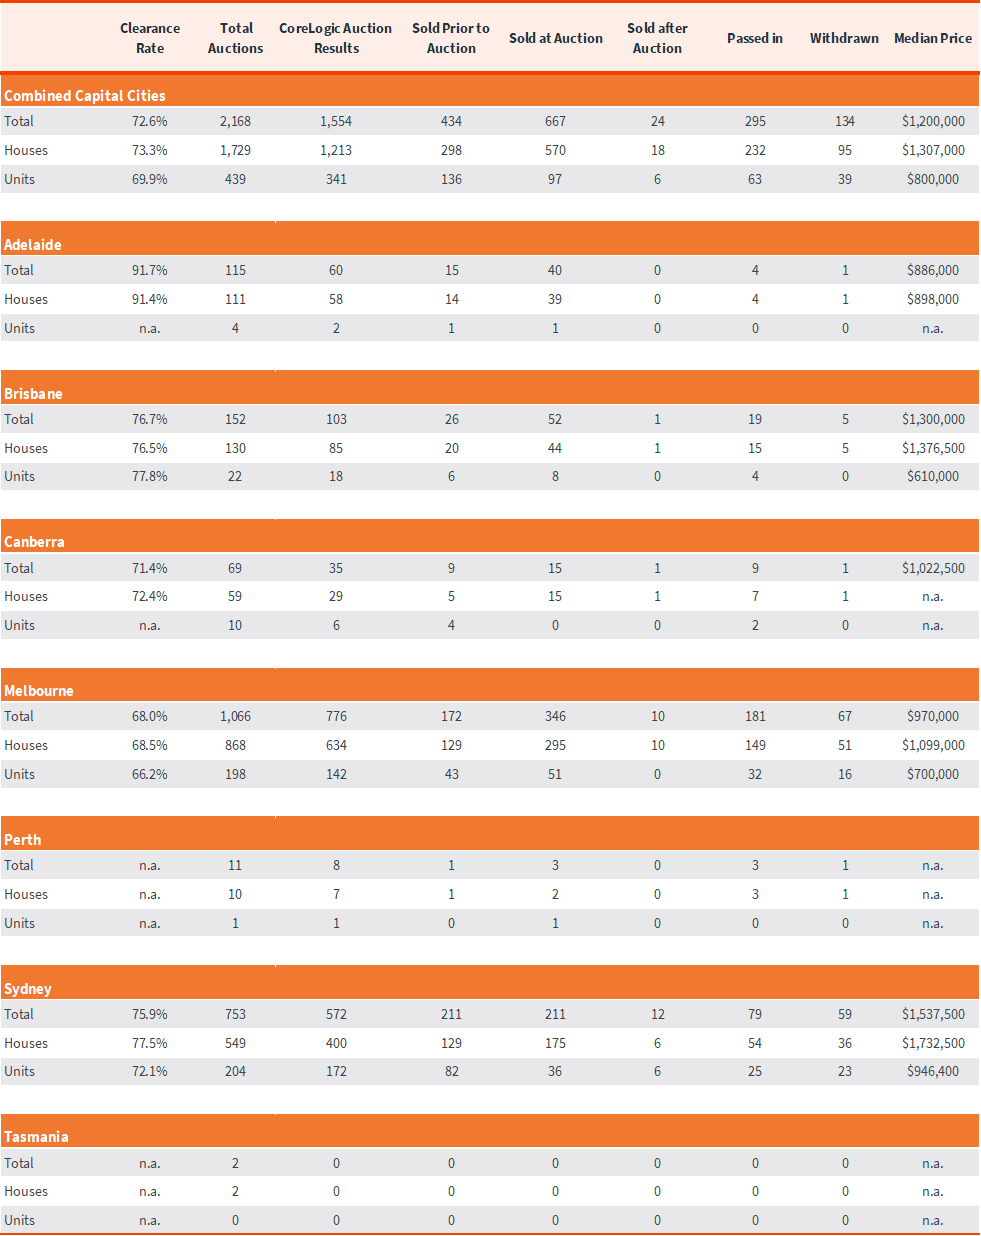
The above results are preliminary, with ‘final’ auction clearance rates published each Thursday. CoreLogic, on average, collects 99% of auction results each week. Clearance rates are calculated across properties that have been taken to auction over the past week.
Sub-region auction statistics (preliminary)
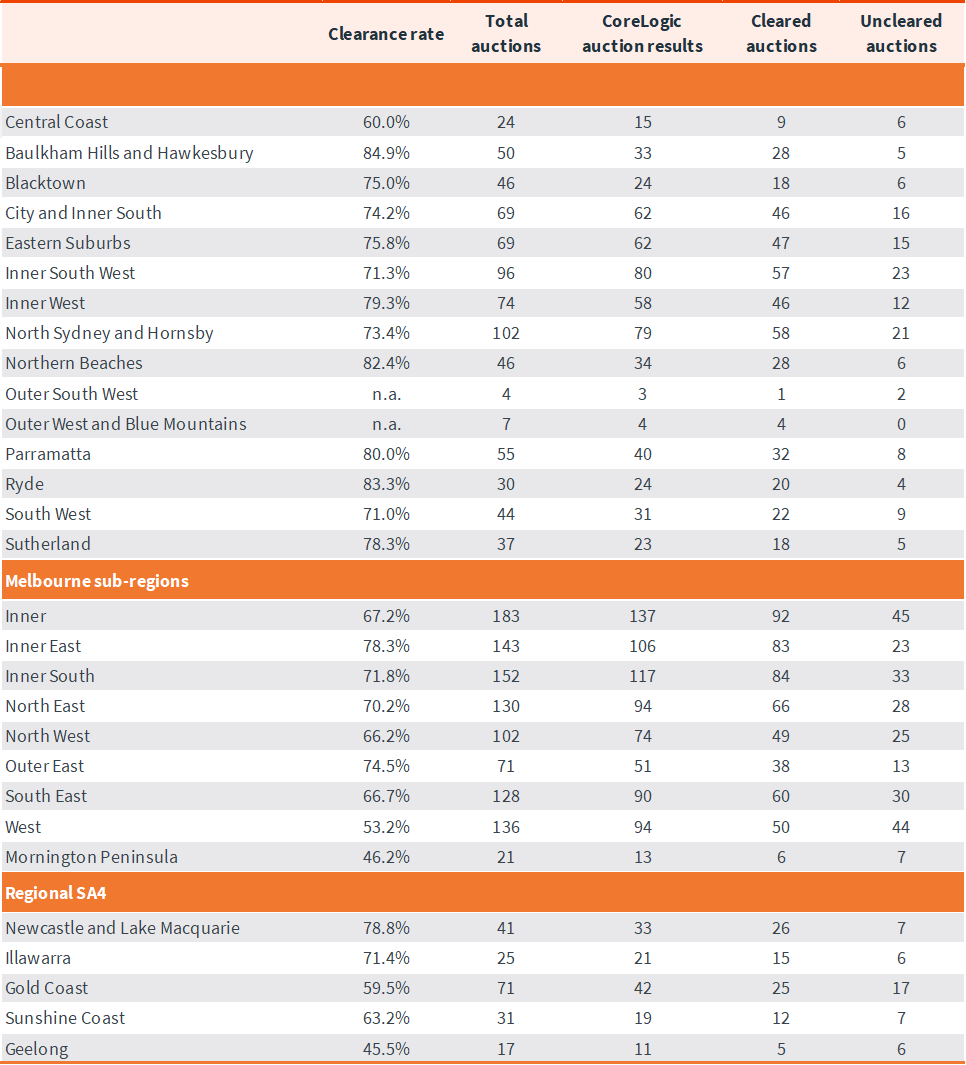
CoreLogic, on average, collects 99% of auction results each week. Clearance rates are calculated across properties that have been taken to auction over the past week.
Download Property Market Indicator Summary
