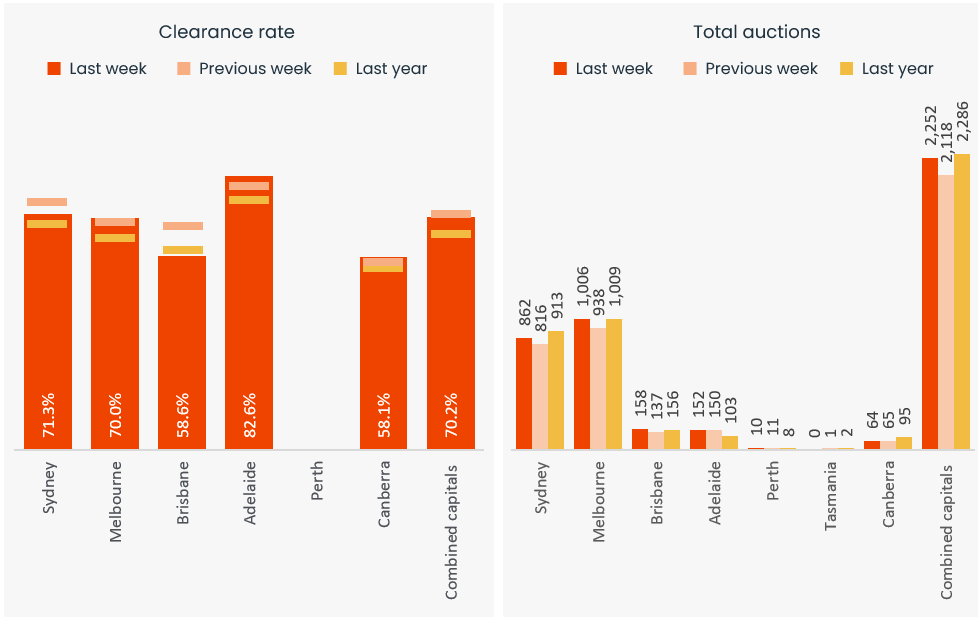
The last week of winter saw 2,252 auctions held across the capital cities, the highest volume of properties going under the hammer since the first week of June, book-ending the cooler months. This week is set to see a similar volume of auctions held before ramping up to around 2,400 through the second week of spring.
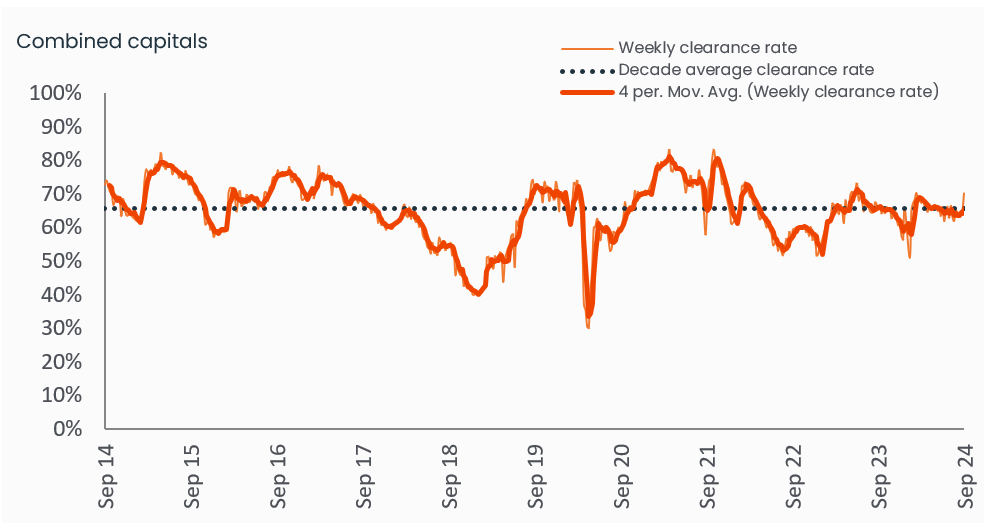
The preliminary auction clearance rate slipped a little amid the higher volume, coming in at 70.2%, 1.2 percentage points lower than a week ago and 90 basis points below the average preliminary clearance rate through winter (71.1%).
Capital City Auction Statistics (Preliminary) – headline results
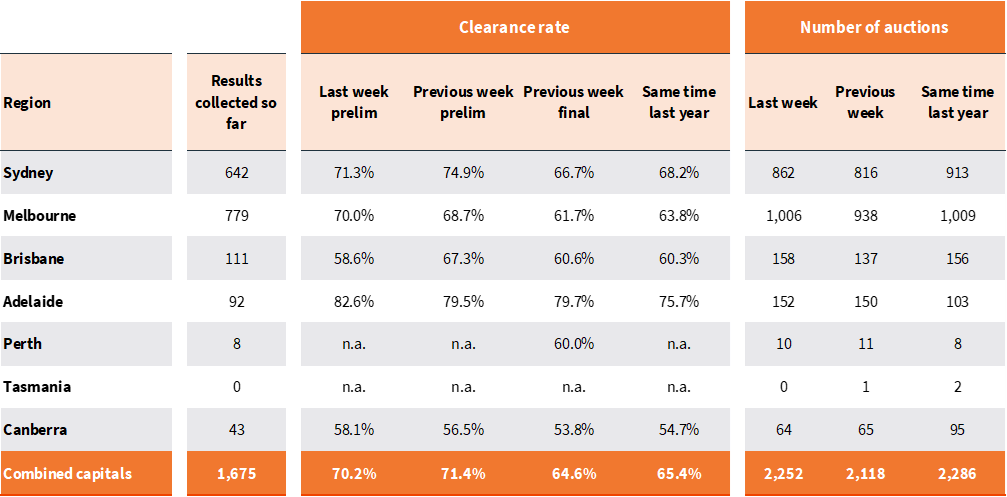
Melbourne recorded the most auctions over the week. With 1,006 homes taken to market, this was the first time we have seen Melbourne break the 1,000 mark since mid-June. The preliminary clearance rate held up well under the higher volume, rising to 70.0%, 1.3 percentage points higher than the previous week (68.7% which revised down to 61.7% once finalised) and the highest preliminary clearance rate since the first week of August.
862 homes were auctioned in Sydney, the highest volume since the week ending June 2nd (899), with the preliminary clearance rate dropping 3.6 percentage points to 71.3%.
Across the smaller auction markets, the volume of auctions hasn’t shown the same seasonal rise as the largest capitals. Brisbane hosted the most auctions (158) which was roughly in line with the average weekly volume through winter (156). 152 homes went under the hammer across Adelaide which was above the weekly winter average (135) but in line with the number of auctions held over the past three weeks. 64 auctions were held in Canberra, above the winter average of 57, but well below the 91 auctions held two weeks ago. Adelaide continued to show, by far, the highest preliminary clearance rate at 82.6% while Brisbane (58.6%) and ACT (58.1%) recorded softer results.
Only ten auctions were held in Perth with three quarters returning a successful result and no auctions were held in Tasmania.
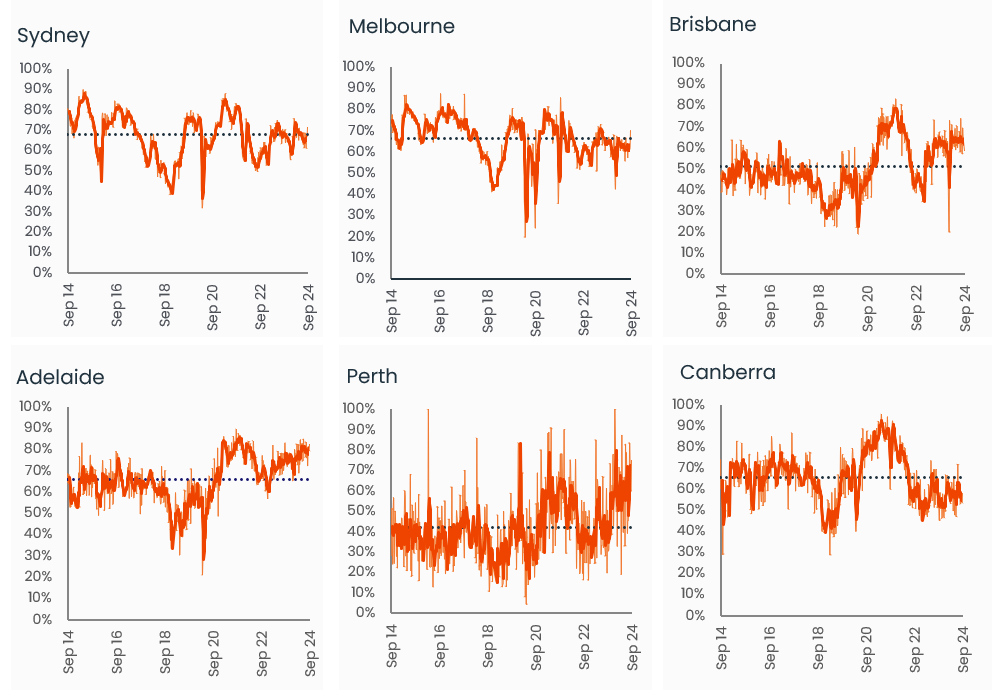
Capital City Auction Statistics over time
Historical clearance rates utilise the final auction clearance rate, while the current week is based on the preliminary clearance rate.
With the volume of auctions set to trend higher through spring, we will see the depth of purchasing demand tested. On average, the spring season sees around a 20% uplift in new listings across the capital cities compared with winter, while sales activity records far less seasonality (the volume of sales shows an 8.7% uplift between winter and spring based on the decade average). Given the range of demand side barriers, including affordability constraints, easing population growth, less ability to save and an erosion of borrowing capacity, there is a good chance the uplift in listings won’t be met by a commensurate rise in purchasers.
Watch out for CoreLogic’s August Home Value Index (HVI), released today (Monday 2nd September), which provides a comprehensive assessment of market conditions through August and an outlook for the months ahead.
Capital City Auction Statistics (Preliminary)
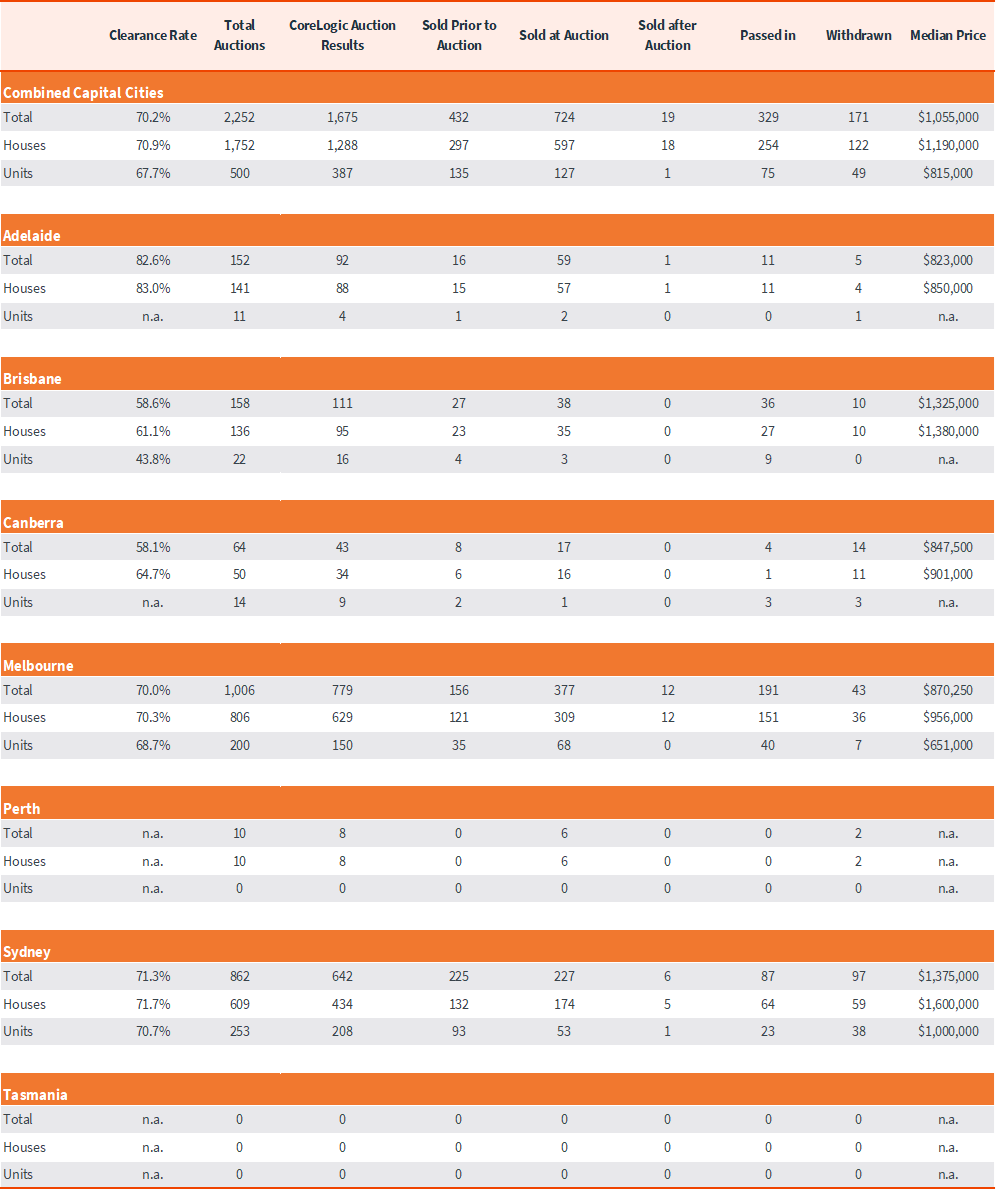
The above results are preliminary, with ‘final’ auction clearance rates published each Thursday. CoreLogic, on average, collects 99% of auction results each week. Clearance rates are calculated across properties that have been taken to auction over the past week.
Sub-region auction statistics (preliminary)
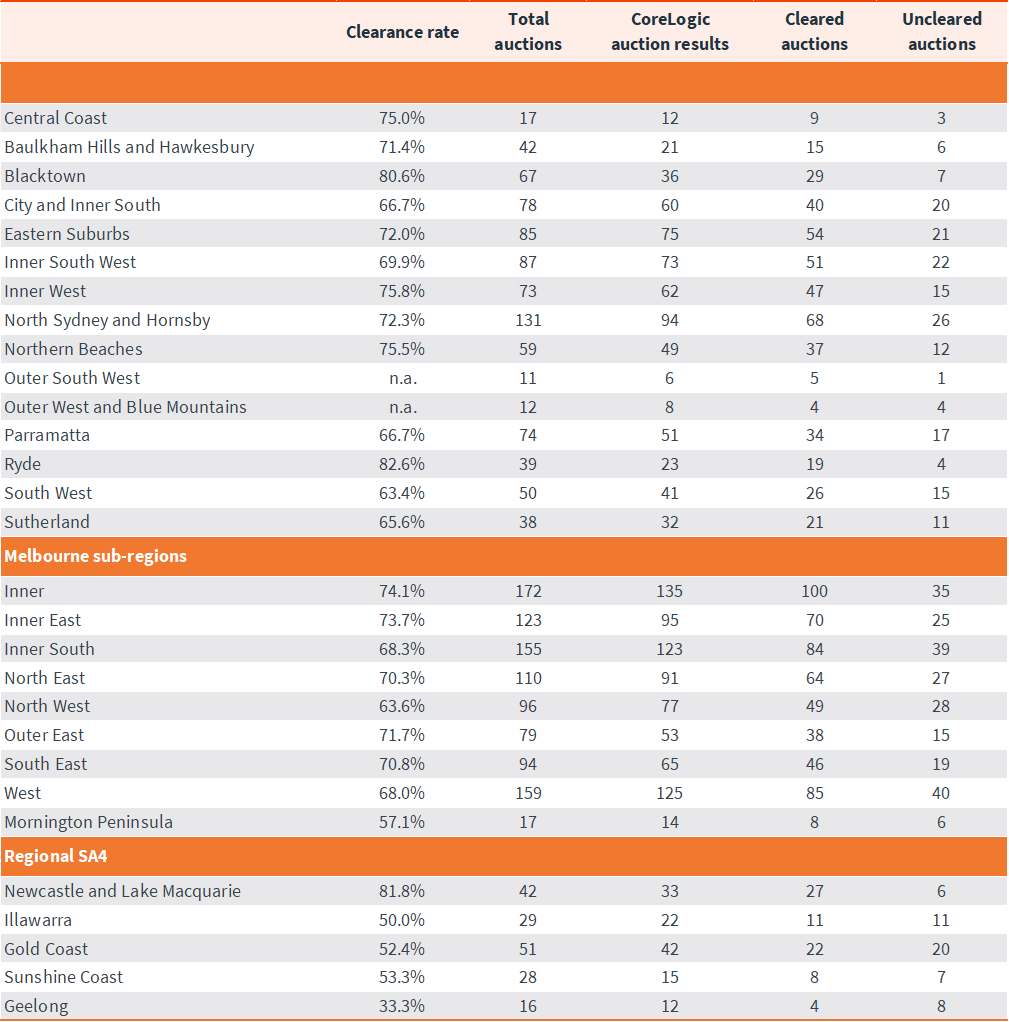
CoreLogic, on average, collects 99% of auction results each week. Clearance rates are calculated across properties that have been taken to auction over the past week.
Download Property Market Indicator Summary
