Here are the must know stats, facts and figures on Australia's residential property market.
Unit rental growth slows in major capitals Sydney, Melbourne and Brisbane
In CoreLogic's Housing Chart Pack, the July 'Chart of the Month' shows a slowdown in annual rental growth across Australia's combined capitals, with the rate falling to 8.6% from a high of 10.6% in April.
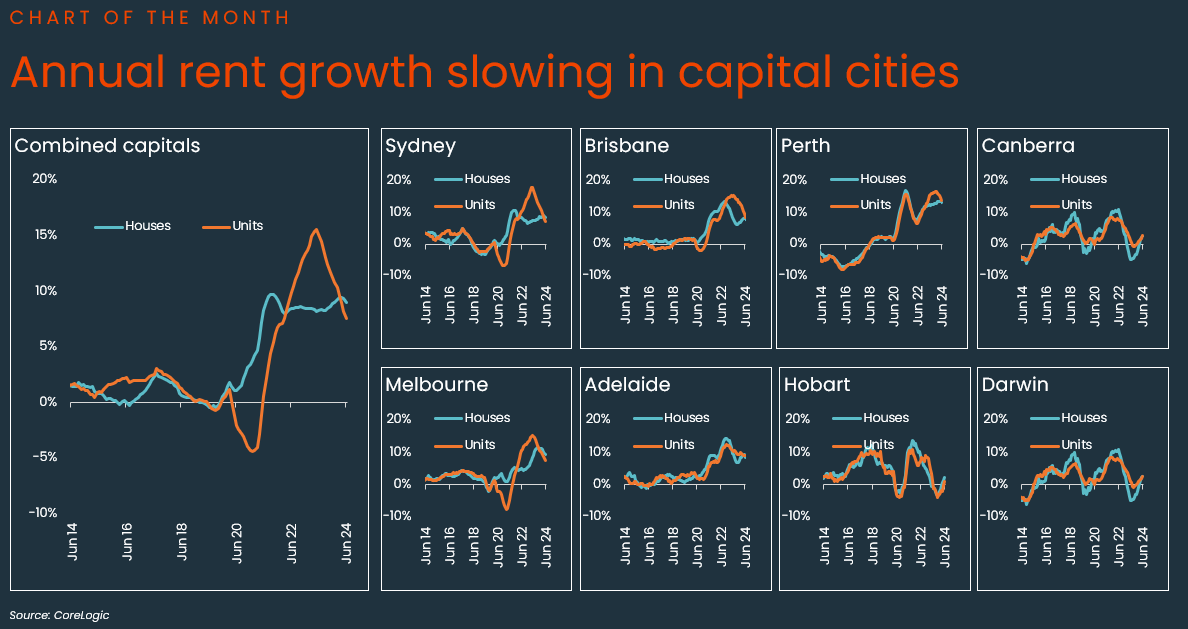
CoreLogic Head of Research Australia, Eliza Owen said over the past year the growth rate in capital city unit rents has come down from 15.1% to 7.6%, with the biggest slowdowns in major capitals Sydney, Melbourne and Brisbane.
"Although rents have not actually declined year-on-year, there is a clear slowing in the pace of annual growth across the large inner city unit markets of Sydney, Melbourne and Brisbane. This likely reflects an easing in demand, with apartment rental growth not sustaining a strong rate as last year and comes amid early signs of easing net overseas migration, which according to ABS data peaked in the March quarter of 2023."
In Sydney, the annual rate of growth for unit rents fell a whopping 10 percentage points to 7.1%. Melbourne unit rents dropped 7.4 percentage points in the past year to 7.5%, and annual growth in Brisbane unit rents slowed from 15.3% this time last year to 8.5% in the past 12 months.
Ms Owen noted that however for Sydney and Melbourne unit markets, the growth rate remains well above the historic averages, which was respectively 2.7% and 2.6% throughout the 2010s.
"While Sydney and Melbourne still have a much higher growth rate than the historic annual average, the consistent slowdown in growth is an early sign of demand pressures slowing in the market. Clearly, rental demand is not strong enough to sustain ongoing, double-digit growth across these cities."
"In contrast, annual growth in house rents has increased slightly and regional rents have also re-accelerated. This suggests rental demand may also be pivoting away from capital city unit rentals towards capital city houses and the regional market," she concluded.
Other highlights from the July Housing Chart Pack include:
- CoreLogic estimates the combined value of residential real estate rose to $10.8 trillion at the end of June.
- The pace of quarterly growth has started to ease, to 1.8% in the June quarter. This is down from 1.9% in the March quarter of this year, and down from 3.3% in the June quarter of 2023.
- The change in home values continues to be highly varied across the capital city markets, and within capital city markets. In the June quarter, Perth home values increased 6.4% while Melbourne values fell 0.6% in the quarter.
- CoreLogic estimates there were 37,148 sales in June, taking the national annual count to 508,610. This is 8.6% above sales volumes last year.
- The time it takes to sell property has trended a little higher relative to one year ago nationally. As with capital growth trends, selling conditions are varied depending on the market. Properties are selling in less time than a year ago in Perth, Brisbane and Adelaide, with the median selling time in Perth at just 10 days.
- The vendor discounting trend is smaller than a year ago nationally, but has deepened a little across the combined capitals in rent months. Similar to capital growth conditions, the selling environment for vendors varies by market.
- In the four weeks to July 7, new listings totaled 37,029 nationally. New listings are in a slight seasonal slowdown, however the flow of new listings is trending 7.8% higher than last year, and 5.1% higher than the historic five-year average.
- Total listings are holding reasonably firm, currently trending 0.6% higher than this time last year. However, total listings are still 17.3% lower than the historic five-year average, highlighting persistent undersupply that has contributed to ongoing value increases nationally.
- The rolling four-week average auction clearance rate trended slightly lower through June. In the four weeks to June 30, the combined capital cities clearance rate averaged 64.2%, down from 65.1% in the previous four-week period.
- Annual growth in rent values slowed to 8.2% nationally, reflecting an incremental easing in the rate of rental growth at a high level. Growth in rents over the month of June slowed to 0.4%, which is the lowest rate of monthly growth rate since September last year.
- Dwelling approvals had a strong 5.5% lift in May, led by a 14.2% lift in unit approvals. Dwelling approval readings are still well below historic averages, but it is possible they passed through a trough at the beginning of 2024.
- The value of new housing lending secured fell 1.7% in May. The drop was comprised of a faster fall in owner-occupier lending, which has pushed the share of new investment lending higher, to 37.1%. The May share of investment lending was the highest monthly result recorded since May 2017 (37.5%).
- The Chart of the Month shows the rolling annual growth in rent values, split by houses and units across the capital city markets. Annual growth in rent values has slowed to 8.6% in the combined capital cities, which could indicate a slowdown in the rent component of inflation. The biggest slowdowns in growth over the year have been in the unit markets of Sydney, Melbourne and Brisbane.
Download the Monthly Housing Chart Pack
CoreLogic Australia