Here are the must know stats, facts and figures on Australia's residential property market.
Tight supply lifts housing markets in Australia's mid-sized capitals
In CoreLogic's Housing Chart Pack, the June 'Chart of the Month' shows the surplus or deficit of total listings relative to where listings have been historically.
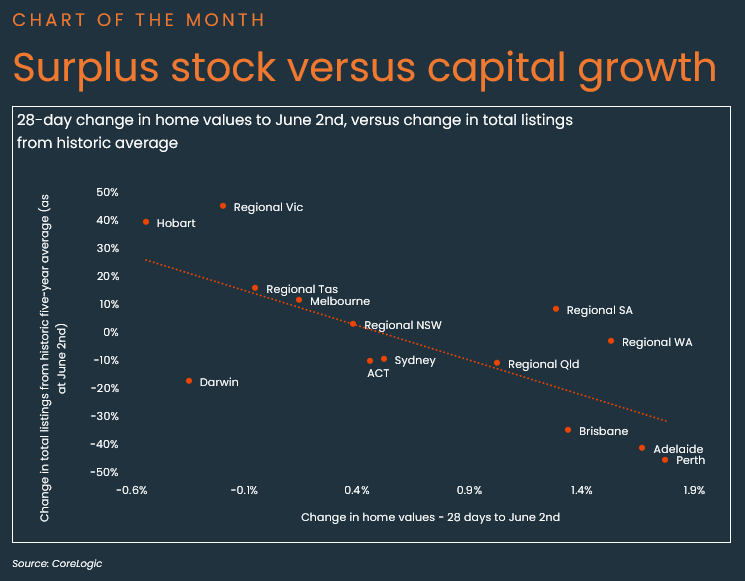
CoreLogic Head of Research Australia, Eliza Owen said one of the clearest indicators of varied market performance comes back to the supply-demand position of the states and territories.
"At one end of the spectrum is Perth, with total listings sitting -45% below average stock levels, and a monthly capital growth rate of 1.8%. At the other end of the spectrum is Hobart, where there are 39.5% more listings than the historic 5-year average for this time of year, and home values are 0.5% lower. The additional choice in stock across areas like Victoria and Tasmania means vendors have to bring down their price expectations, and that brings values down."
Ms Owen says underneath the supply-demand dynamics there are multiple factors at play.
"On the demand side, lower price points across Perth, Adelaide and parts of Brisbane continue to drive buyers, even under high interest rates. Interstate migration remains particularly strong in QLD and WA, and income relative to home values is also more reasonably matched in Perth.
"On the supply side, there has been more of a build up in new listings than usual across Victoria, even where home value performance has been relatively soft. Victoria has also had more dwellings completed than any other state and territory in the past ten years, keeping a lid on price growth."
Other highlights from the June Housing Chart Pack include:
- CoreLogic estimates the combined value of residential real estate rose to $10.7 trillion at the end of May.
- The pace of quarterly growth continued to tick higher in May, with values up 1.9%, up from a recent low of 1.1% over the three months to January.
- Despite the uptick in quarterly growth, annual growth continued to ease from 9.4% over the year to February, to 8.3% over the 12 months to May.
- Over the three months to May, lower quartile dwelling values (3.0%) rose at more than twice the pace of upper quartile values (1.2%), with growth conditions continuing to be skewed toward the more affordable section of the market.
- Perth dwellings once again led the capitals in value growth, up 6.1% in the three months to April and up 22.0% over the past year.
- New listings are trending higher than the historic five-year average and higher than this time last year, driven by above-average vendor activity in Sydney and Melbourne in particular.
- Despite new listings tracking above average, overall listings levels have remained fairly subdued, due to a strong rate of absorption from sales. Across the states and territories, Victoria stands out as having significantly higher total listings than this time last year.
- Compared to this time last year, annual national estimates are up 7.1%, but have eased slightly from an annual peak of 505,623 in the 12 months to April.
- The national median time on market was 31 days in the three months to May, which is steady on this time last year. Beneath the relatively stable national figures, days on market across Perth dropped to just 10 days (from 15 days this time last year), while homes are taking longer to sell in Sydney, Melbourne and Hobart.
- The combined capital cities clearance rate has gradually trended lower since early February, suggesting slightly weaker selling conditions amid high interest rates and a weakening economic environment.
- The June ‘Chart of the Month’ compares the amount of stock on the market relative to a historic five-year average, with the monthly change in home values. Areas with above-average stock, like Tasmania and Victoria, tend to have an over-supply of housing relative to demand for purchases, creating a buyer’s market and putting downward pressure on prices.
Download the Monthly Housing Chart Pack
CoreLogic Australia