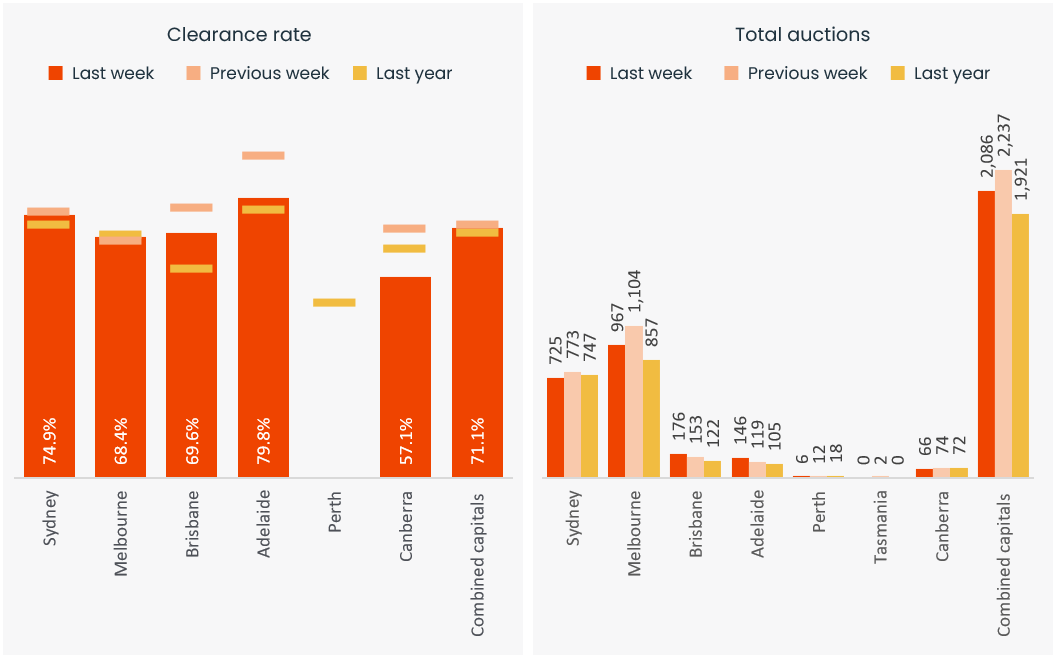
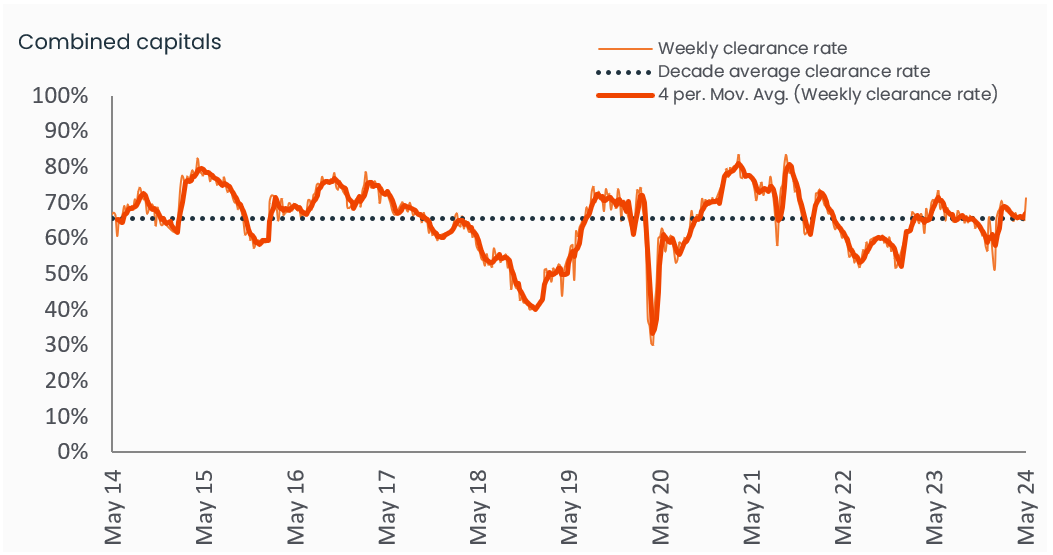
The preliminary auction clearance rate continued to fade last week, reducing to 71.1% across the combined capitals. The result was 1.5 percentage points lower than the previous week’s result (72.6% which revised down to 65.1% on final numbers) and equal with the Easter long weekend to be the lowest preliminary clearance rate so far this year.
The softer result came with a reduction in volume, with 2,086 auctions held, down from 2,237 over the previous week but higher than a year ago when 1,921 auctions were held.
Tracking the scheduled number of auctions, this week should see a rise in auctions held, with around 2,200 currently being marketed.
Capital City Auction Statistics (Preliminary)
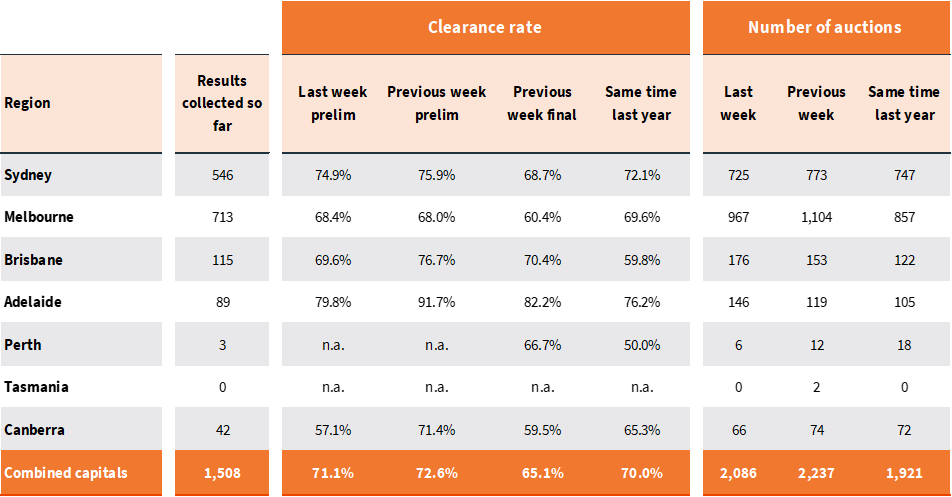
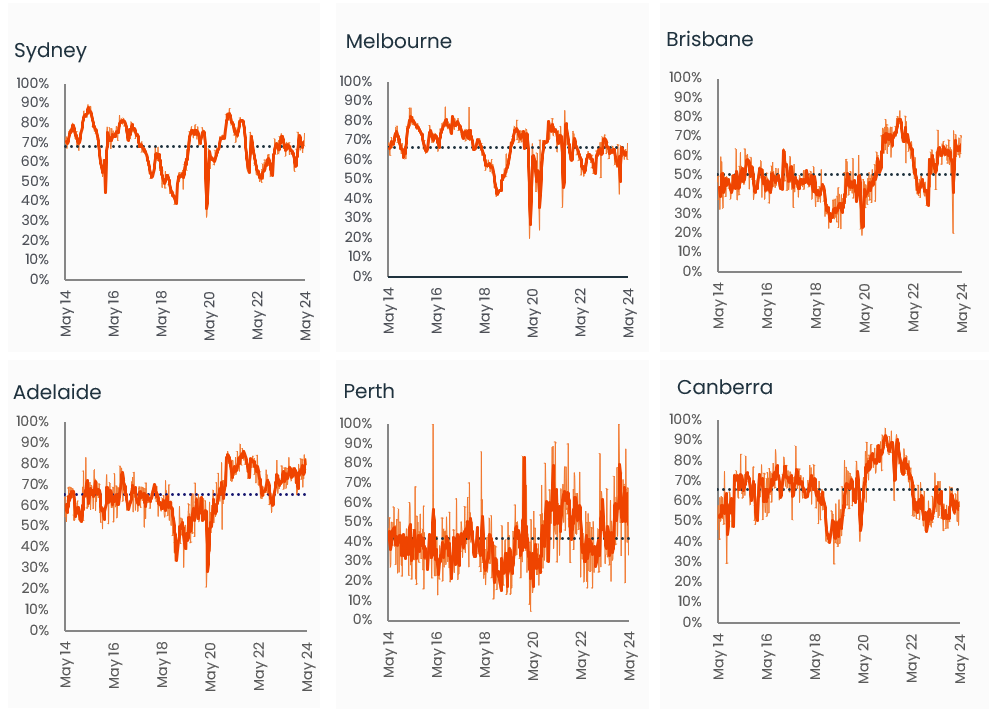
Melbourne was home to the most auctions last week, but the volume slipped below the 1,000 mark with 967 homes going under the hammer. The preliminary clearance rate rose by 40 basis points to 68.4%, up from the previous week’s 68.0% which revised down to 60.4%, the lowest finalised clearance rate since the Easter long weekend (60.3%) and well below the decade average of 66.6%.
Sydney clearance rates have been consistently higher than Melbourne’s, with the early clearance rate coming in at 74.9%, however we are also seeing a fade in the success rate, with last week’s preliminary rate the lowest in four weeks. At 68.7%, the previous week’s finalised clearance rate is holding slightly above the decade average (67.9%).
Capital City Auction Statistics over time
Historical clearance rates utilise the final auction clearance rate, while the current week is based on the preliminary clearance rate.
Among the smaller auction markets, Brisbane held the most auctions with 176 homes going under the hammer, returning a preliminary clearance rate of 69.6%. 146 auctions were held in Adelaide with 79.8% so far showing a successful result, and 66 auctions were held in Canberra with a preliminary clearance rate of 57.1%, the lowest since the last week of February.
From a value perspective we are continuing to see a diverse outcome in the trends. Based on CoreLogic’s daily HVI, Melbourne values are down -0.1% over the past four weeks, continuing a flat to slightly falling trend that has been evident since early April. Sydney is continuing to record a subtle 0.4% rise on a rolling monthly basis, while Perth (+1.8%), Adelaide (+1.5%) and Brisbane (+1.1%) continue to rise at more than 1% month on month.
Capital City Auction Statistics (Preliminary)
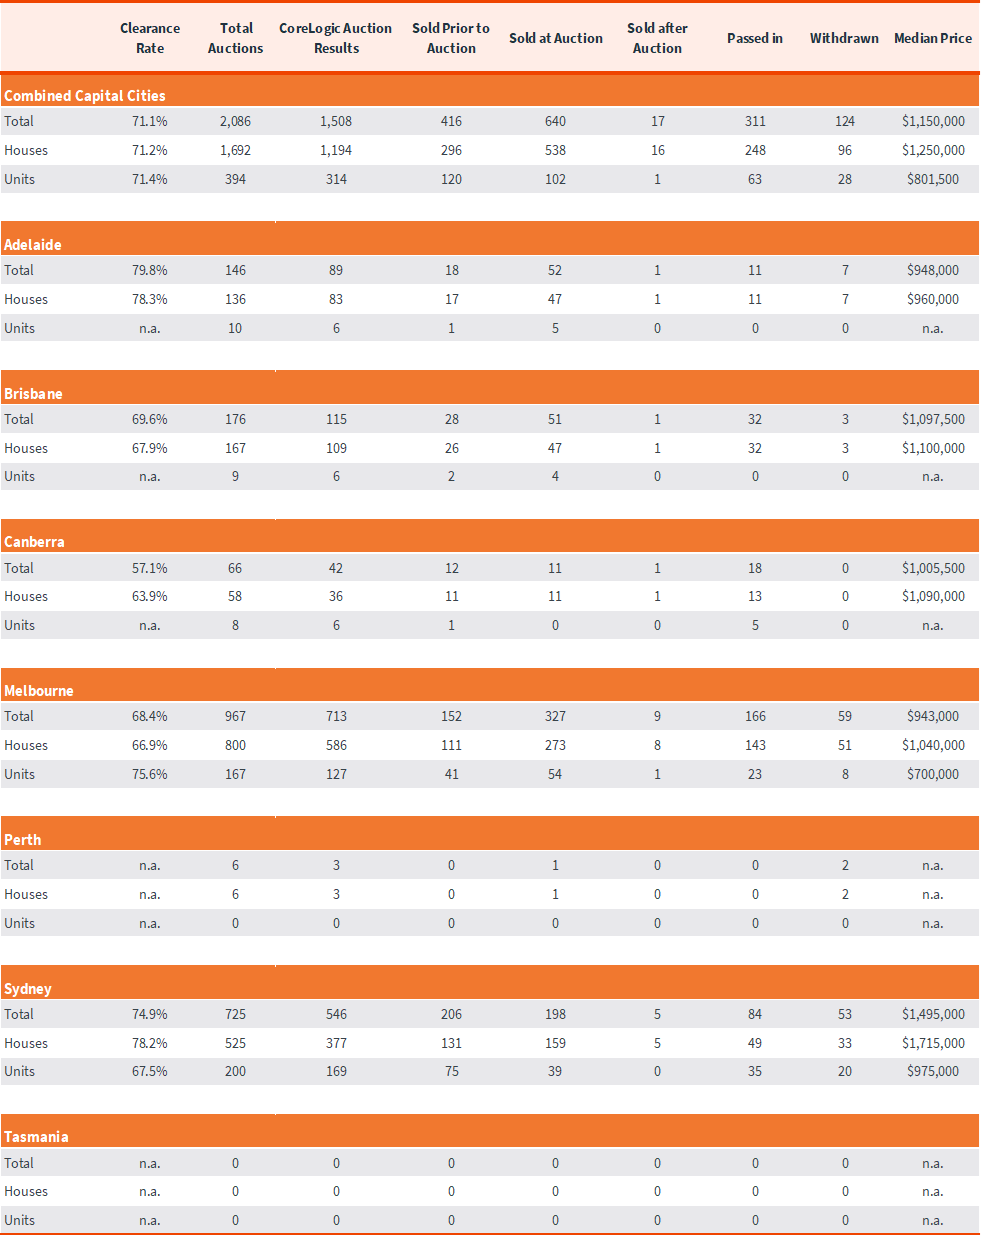
The above results are preliminary, with ‘final’ auction clearance rates published each Thursday. CoreLogic, on average, collects 99% of auction results each week. Clearance rates are calculated across properties that have been taken to auction over the past week.
Sub-region auction statistics (preliminary)
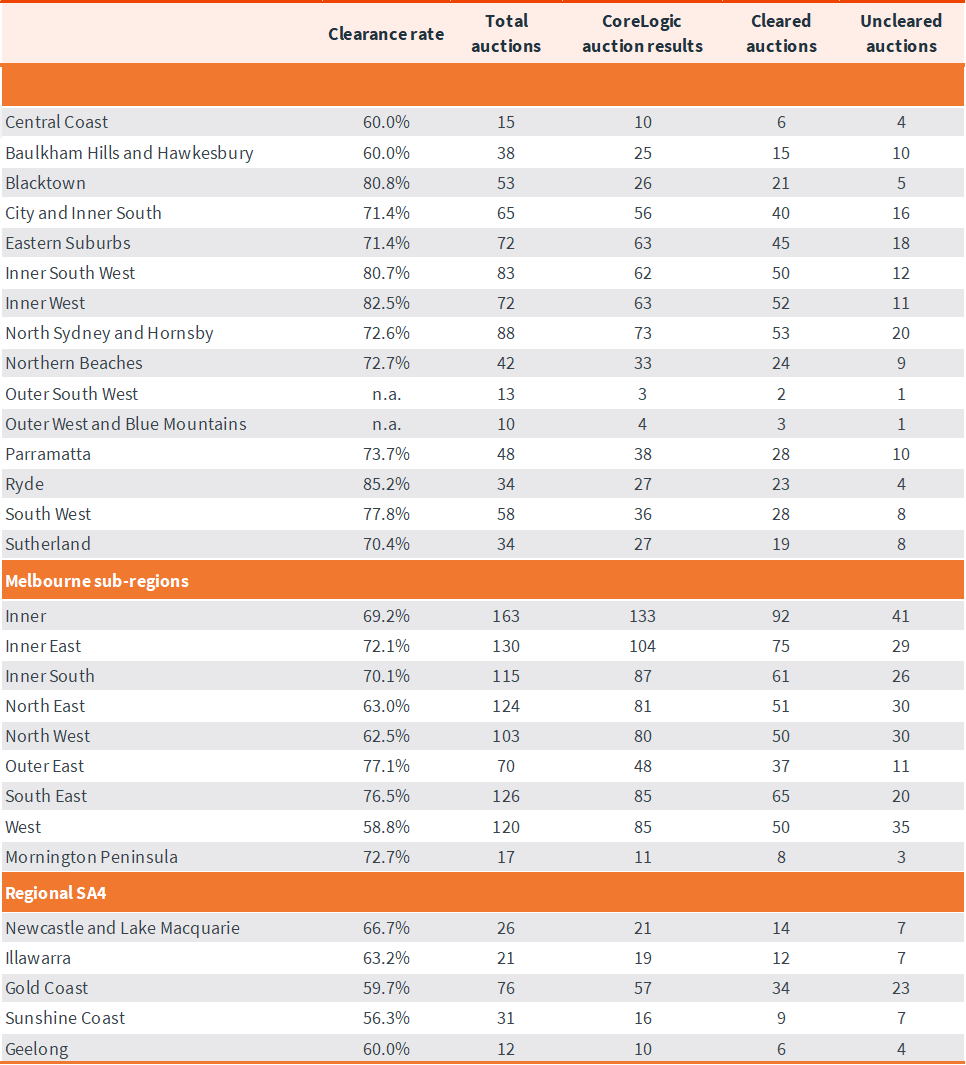
CoreLogic, on average, collects 99% of auction results each week. Clearance rates are calculated across properties that have been taken to auction over the past week.
Download Property Market Indicator Summary
