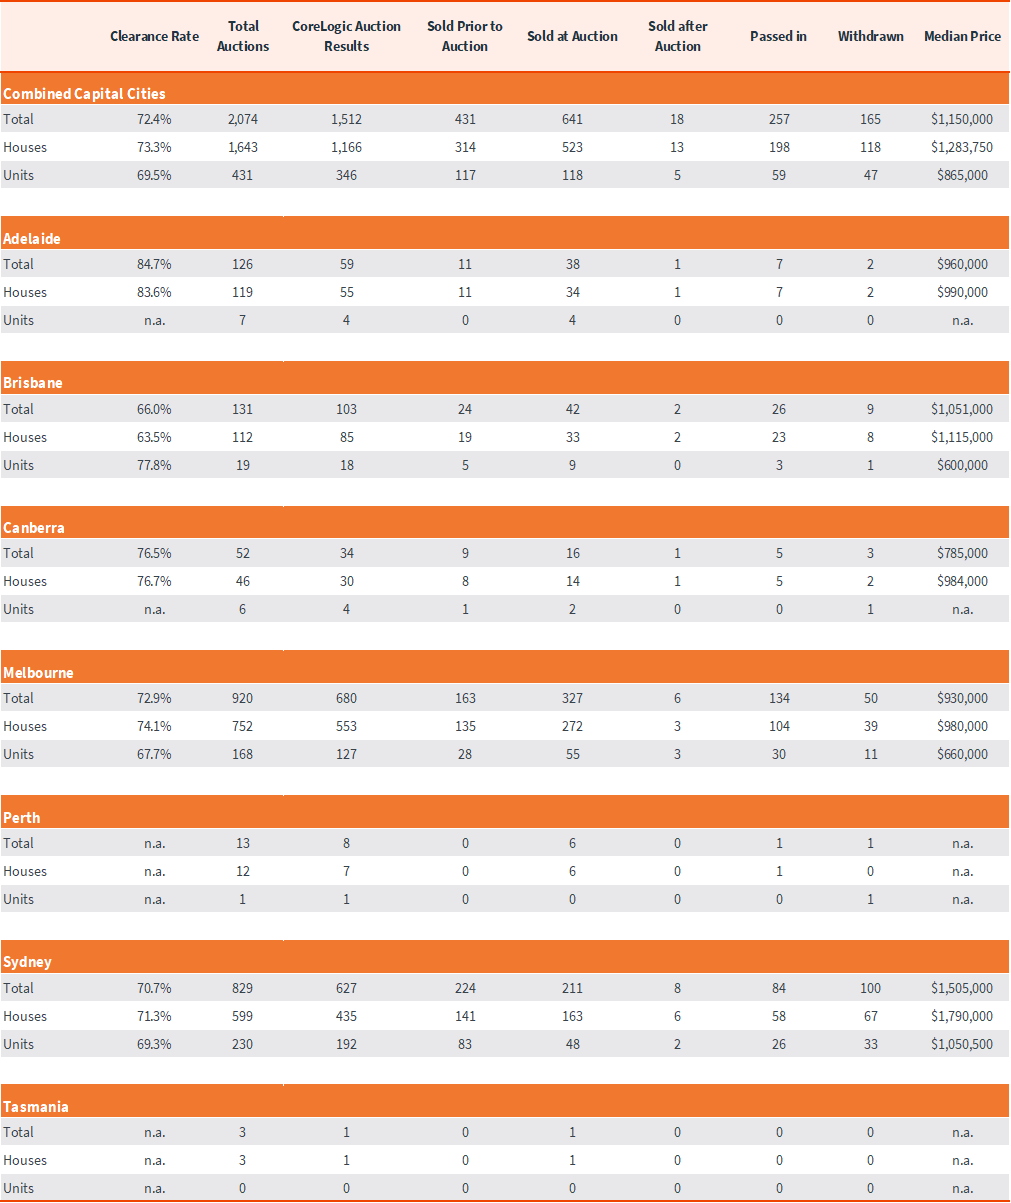
There were 2,074 capital city homes taken to auction last week, compared to 2,276 over the previous week and 1,791 this time last year. The preliminary clearance rate came in at 72.4%, just 50 basis points lower than the previous week’s preliminary clearance rate (72.9%, revised down to 65.5% once finalised).
There were 829 auctions held in Sydney returning a preliminary clearance rate of 70.7%, down -4.3 percentage points on the week prior (75.0%, revised down to 65.5% on final results). The previous week saw 812 homes taken to auction across the city, while 724 auctions were held this time last year.
Across Melbourne, 920 homes were taken to auction last week, compared to 1,083 over the previous week and 744 one year ago. Melbourne’s preliminary clearance rate came in at 72.9%, up 2.7 percentage points from the previous week (70.2%, revising down to 63.7% on final numbers). This is the second highest preliminary clearance rate so far this year, behind the week ending 11th of February (73.1%).
Capital City Auction Statistics (Preliminary)
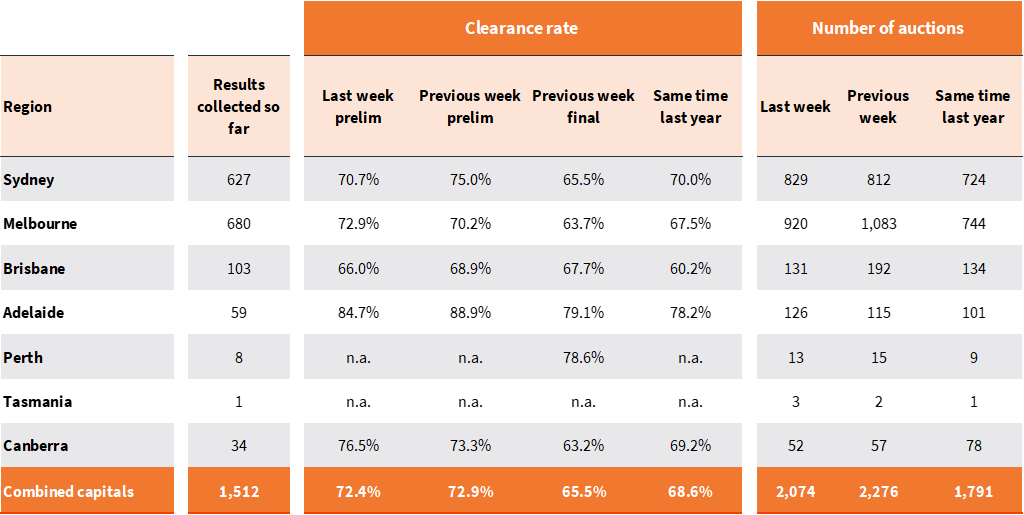
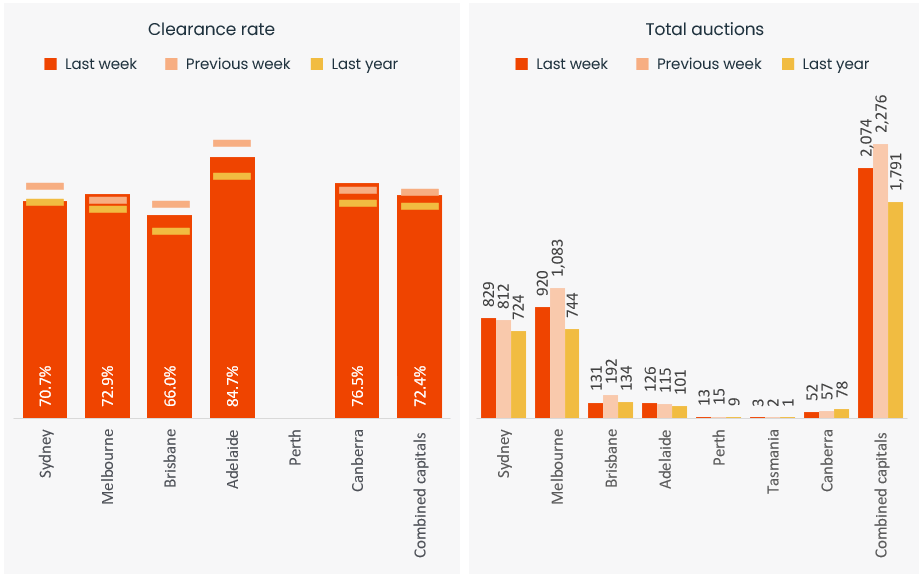
Across the smaller auction markets, Adelaide recorded the highest preliminary clearance rate (84.7%), followed by Canberra (76.5%) and Brisbane (66.0%). There were 131 auctions held across Brisbane, followed closely by Adelaide (126). Canberra saw 52 homes taken to auction, while there were just 13 auctions in Perth and three in Tasmania.
This week we are expecting to see around 2,060 homes taken to auction across the combined capital cities.
Capital City Auction Statistics over time
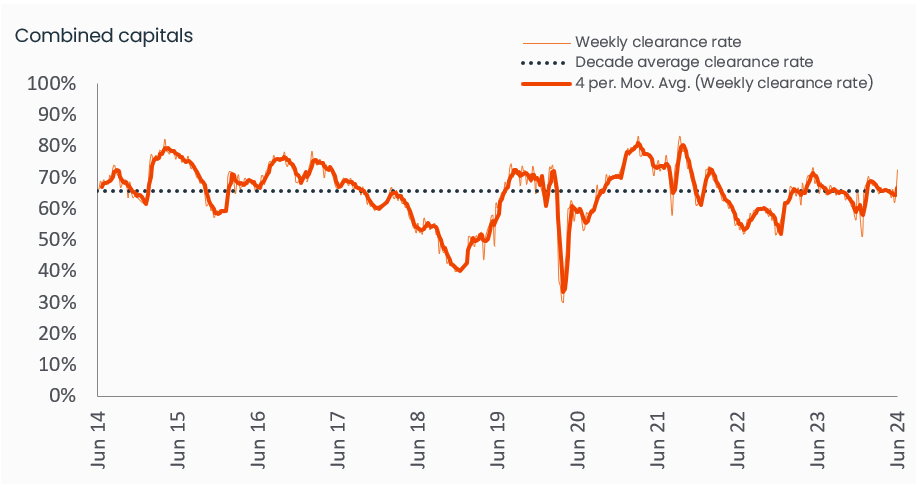
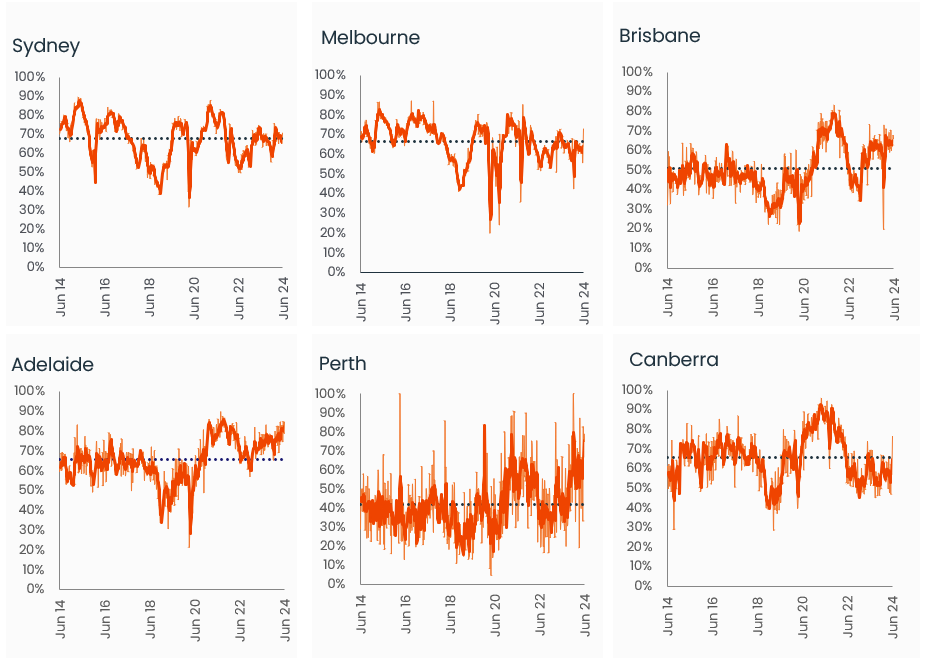
Historical clearance rates utilise the final auction clearance rate, while the current week is based on the preliminary clearance rate.
Capital City Auction Statistics (Preliminary)
The above results are preliminary, with ‘final’ auction clearance rates published each Thursday. CoreLogic, on average, collects 99% of auction results each week. Clearance rates are calculated across properties that have been taken to auction over the past week.
Sub-region auction statistics (preliminary)
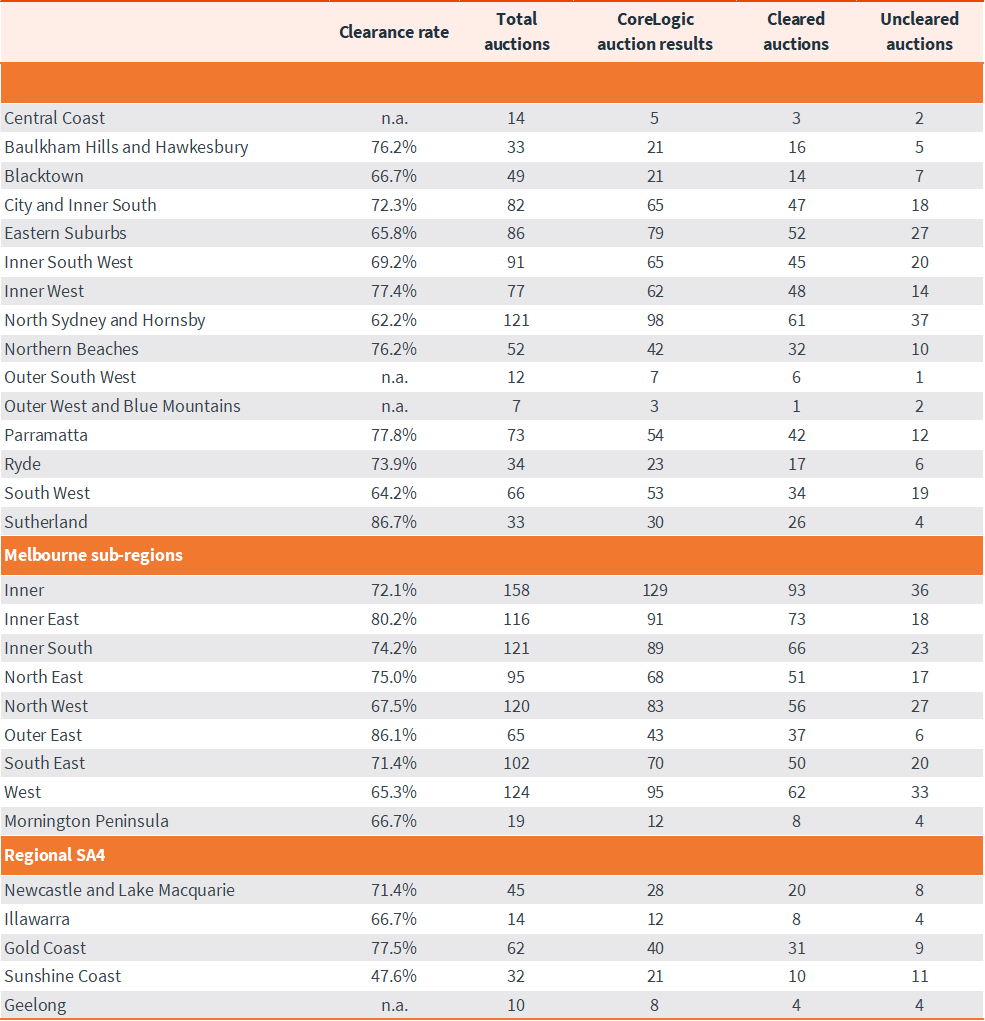
CoreLogic, on average, collects 99% of auction results each week. Clearance rates are calculated across properties that have been taken to auction over the past week.
Download Property Market Indicator Summary

Meet Caitlin Fono
Sr Associate, Research Support
Caitlin has spent more than a decade working with property data and analytics in various roles, earning a position on the CoreLogic research team in 2013. As a respected and highly experienced research analyst, Caitlin works with high frequency data sets, regularly updating our widely read auction reporting, weekly activity updates and customised data briefs.
Full profile