Auction markets moved through a fourth consecutive week where more than 2,000 homes went under the hammer, with a preliminary auction clearance rate of 71.7%, up from 70.2% the week prior (revised down to 64.4% on finalised numbers).
The preliminary clearance rate has held up amid the rise in auction volume and despite a broader rise in advertised stock levels and evidence of some momentum leaving the growth trend.
2,065 homes went to auction last week, down from 2,315 the week prior and lower than a year ago when 2,275 homes were auctioned.
Capital City Auction Statistics (Preliminary) – headline results
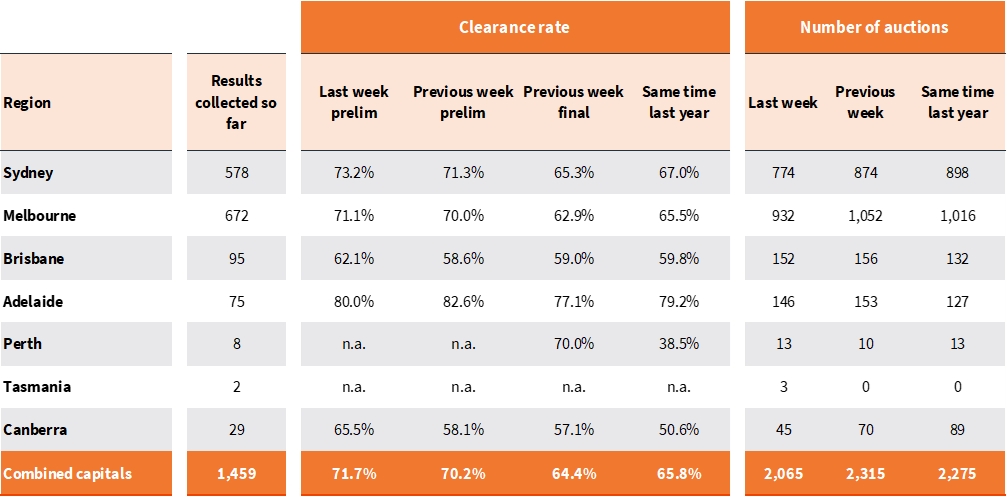
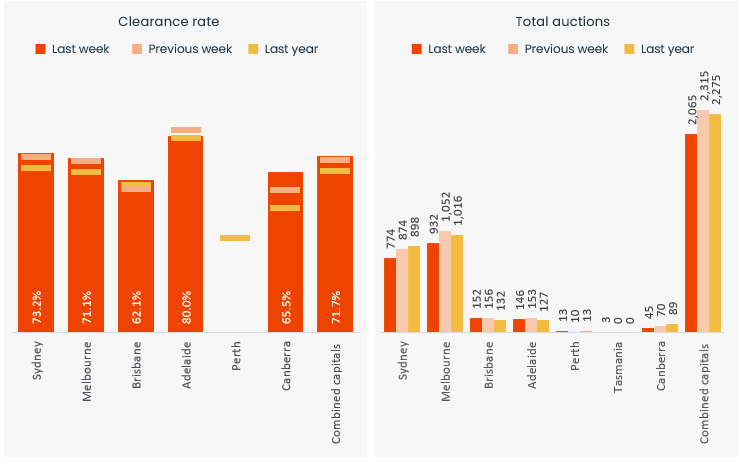
Melbourne saw the most auctions last week, with 932 homes going to auction, down from 1,052 the week prior. The preliminary clearance rate, at 71.1%, ticked a little higher relative to the previous week (70.0% which revised down to 62.9% once finalised).
Sydney hosted 774 auctions last week, down from 874 the week prior, with a preliminary clearance rate of 73.2%, up from 71.3% over the previous week (which revised down to 65.3% on final numbers).
Capital City Auction Statistics over time

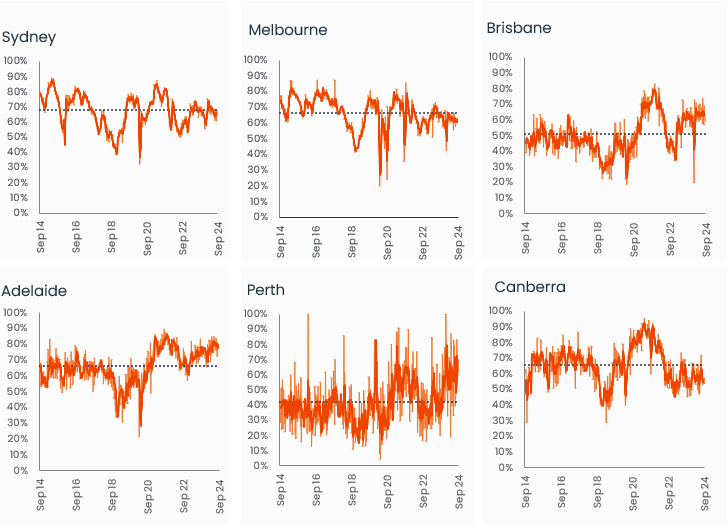
Historical clearance rates utilise the final auction clearance rate, while the current week is based on the preliminary clearance rate.
The volume of auctions across the smaller markets was led by Brisbane, with 152 auctions and a preliminary clearance rate of 62.1%. Adelaide held 146 auctions, with 80% successful on the early numbers, and 45 auctions were held across the ACT with a 65.5% clearance rate.
The volume of auctions is set to rise this week with around 2,480 homes currently scheduled for auction, increasing to approximately 2,780 the following week as the spring selling season gathers pace.
Capital City Auction Statistics (Preliminary)
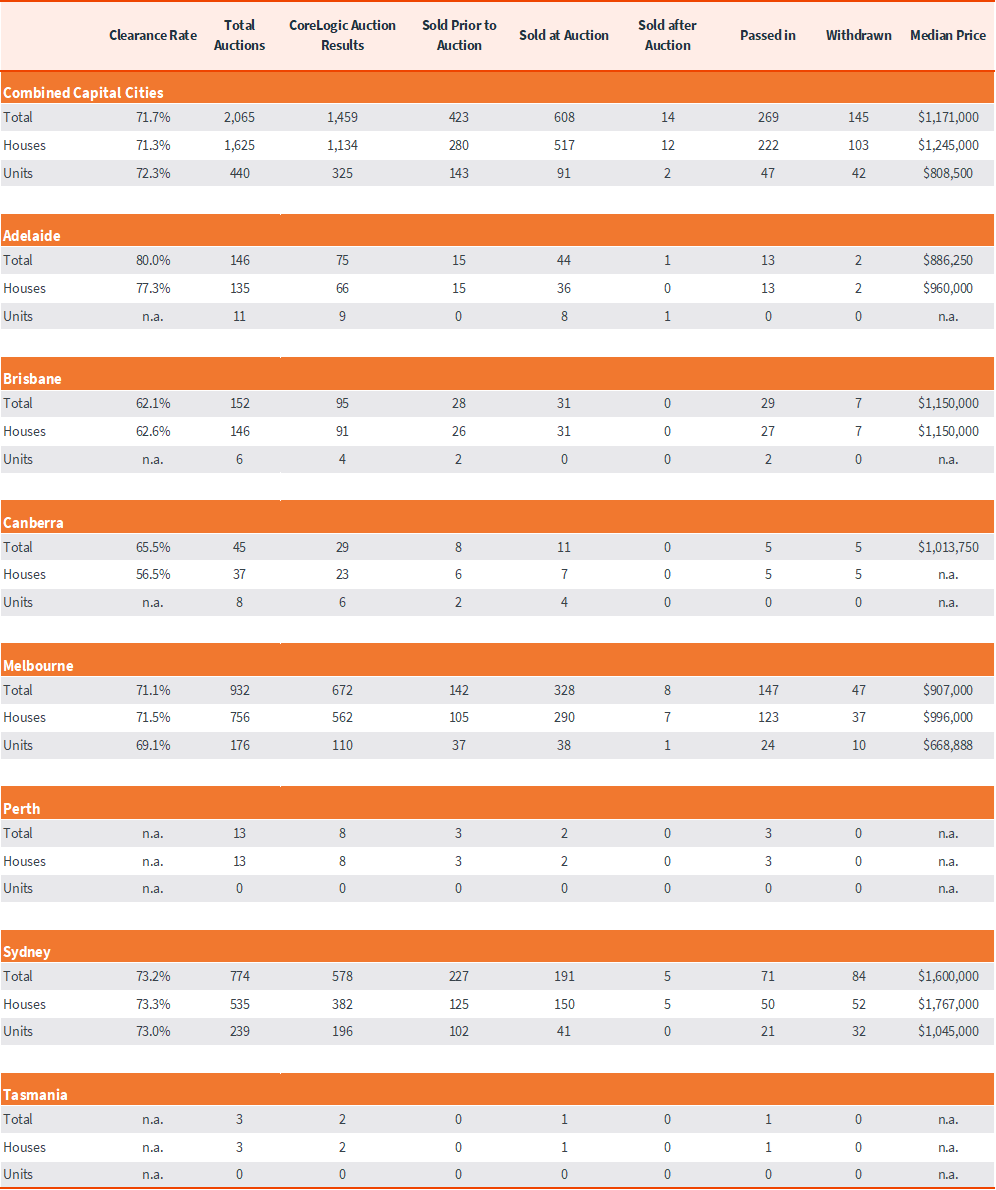
The above results are preliminary, with ‘final’ auction clearance rates published each Thursday. CoreLogic, on average, collects 99% of auction results each week. Clearance rates are calculated across properties that have been taken to auction over the past week.
Sub-region auction statistics (preliminary)
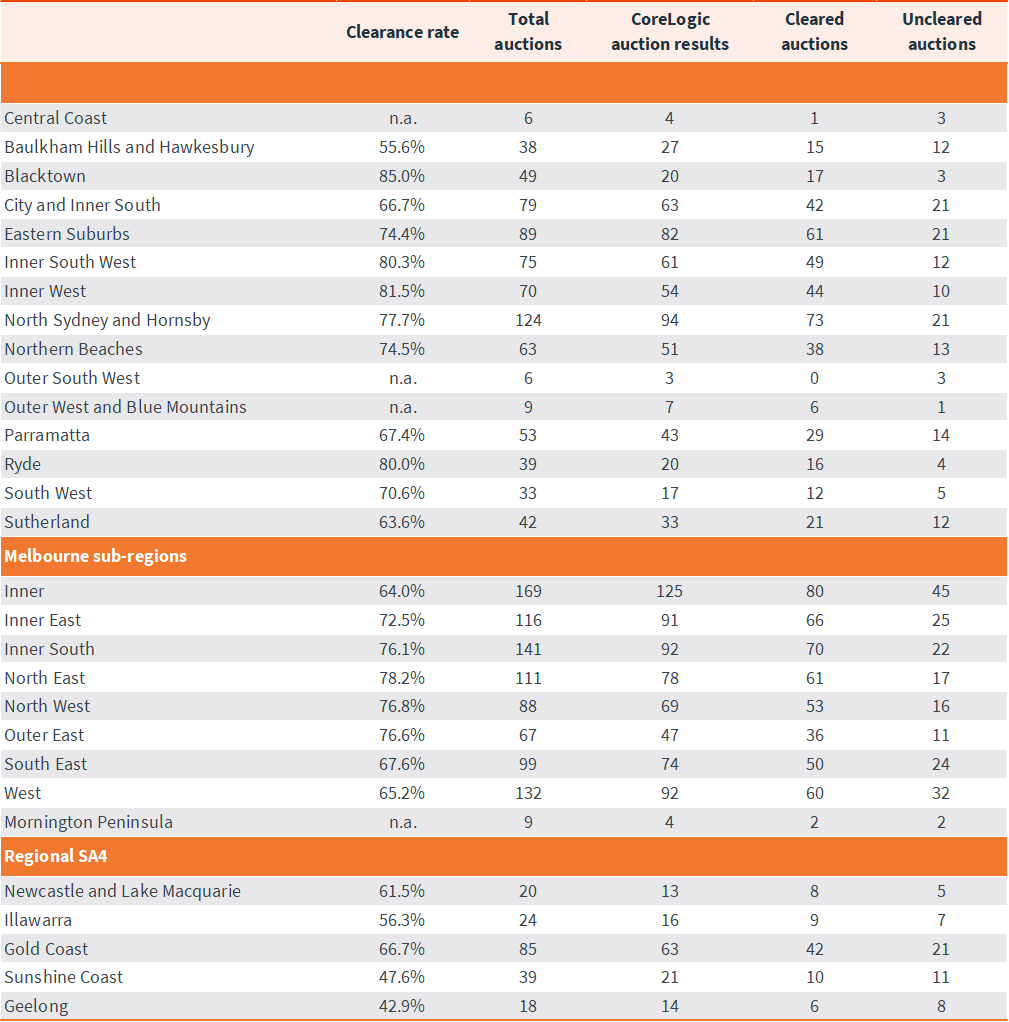
CoreLogic, on average, collects 99% of auction results each week. Clearance rates are calculated across properties that have been taken to auction over the past week.
Download Property Market Indicator Summary

Meet Caitlin Fono
Sr Associate, Research Support
Caitlin has spent more than a decade working with property data and analytics in various roles, earning a position on the CoreLogic research team in 2013. As a respected and highly experienced research analyst, Caitlin works with high frequency data sets, regularly updating our widely read auction reporting, weekly activity updates and customised data briefs.
Full profile