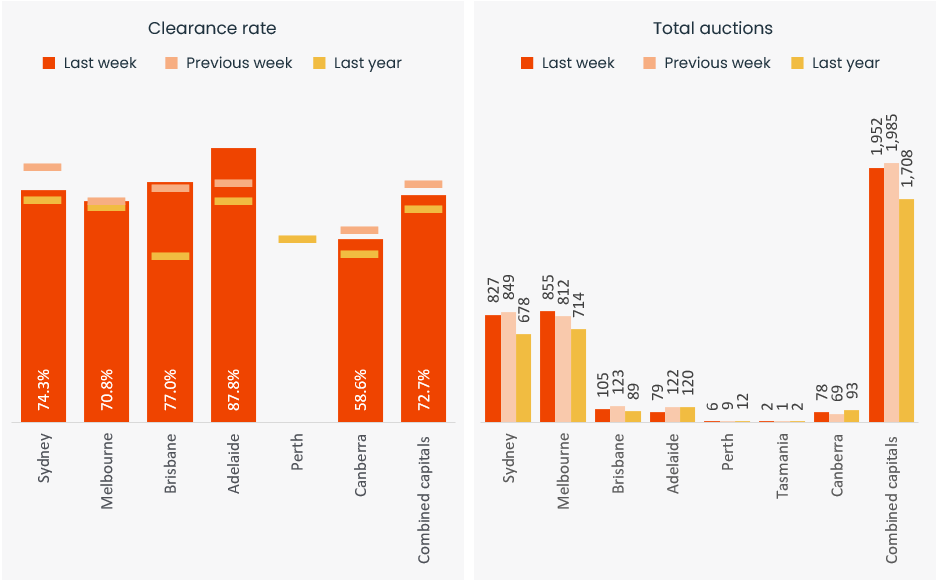
There were 1,952 auctions held last week, roughly on par with the week prior (1,985), but returning a lower preliminary clearance rate of 72.7% (75.9% the previous week revising down to 67.0% once finalised).
The volume of auctions held is well down from the pre-Easter period, when the weekly volumes peaked at 3,519, but well above a year ago when 1,708 auctions were held.
Melbourne hosted the most auctions last week, with 855 homes going under the hammer, returning a preliminary clearance rate of 70.8%, similar to the previous week’s result of 70.6% which revised lower on the final results to 62.8%.
Capital City Auction Statistics (Preliminary)
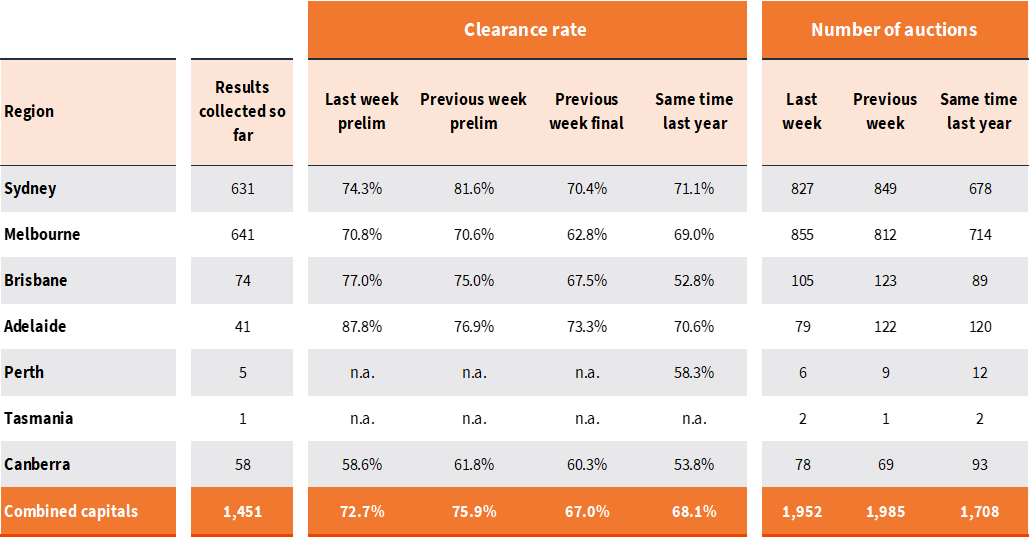
827 homes were taken to auction in Sydney, with 74.3% successful on the early numbers, well down from the previous week’s spike in the preliminary clearance rate which reached 81.6%, revising down to 70.4% on the final numbers.
Adelaide was by far the strongest auction market, with a preliminary clearance rate of 87.8%, up from 76.9% over the previous week (finalised at 73.3%). Brisbane recorded a preliminary clearance rate of 77.0% last week, up from 75.0% (finalised at 67.5%), while in Canberra, 58.6% of auctions have been reported as successful so far, down from 61.8% over the previous week (finalised at 60.3%).
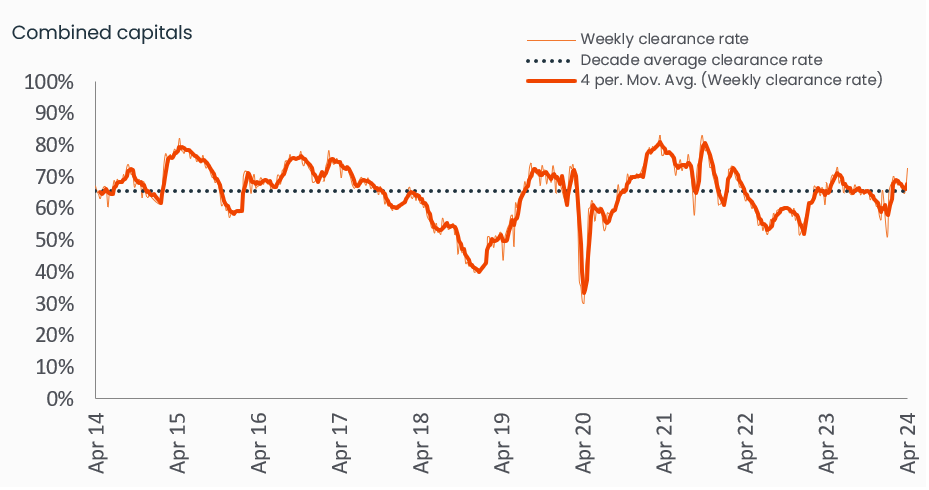
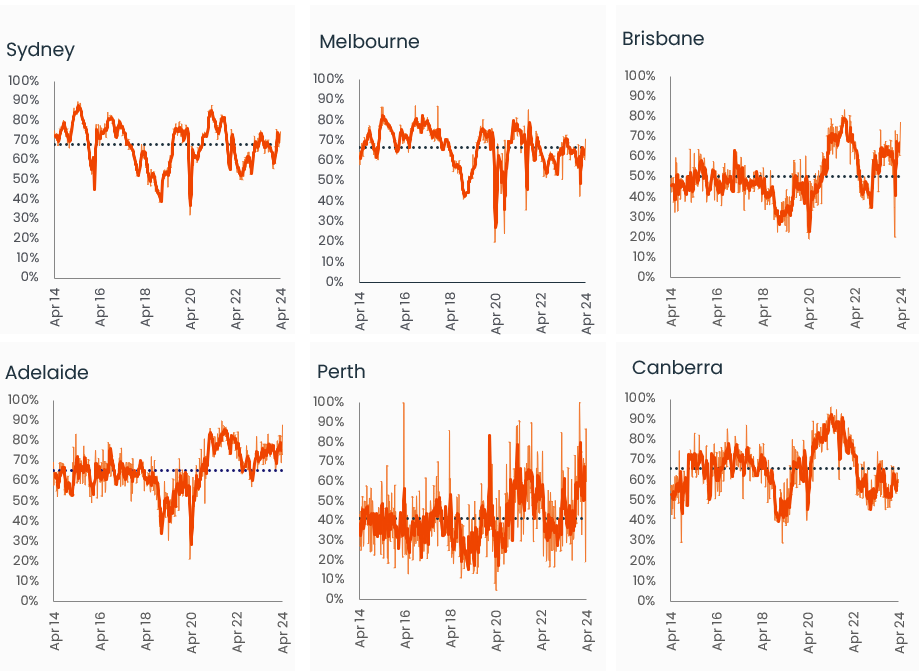
Capital City Auction Statistics over time
Historical clearance rates utilise the final auction clearance rate, while the current week is based on the preliminary clearance rate.
Overall, auction clearance rates are holding reasonably firm, slightly above the long run average of 67.8% on the preliminary clearance rate. Capital city dwelling values are trending higher at the rolling four-week rate of about 0.5%, a slight reduction on the end of March rate (0.6%), with stronger conditions holding in Perth (+1.8%), Adelaide (+1.2%) and Brisbane (+0.9%).
We are expecting around 1,900 auctions to be held this week across the combined capital cities.
Capital City Auction Statistics (Preliminary)
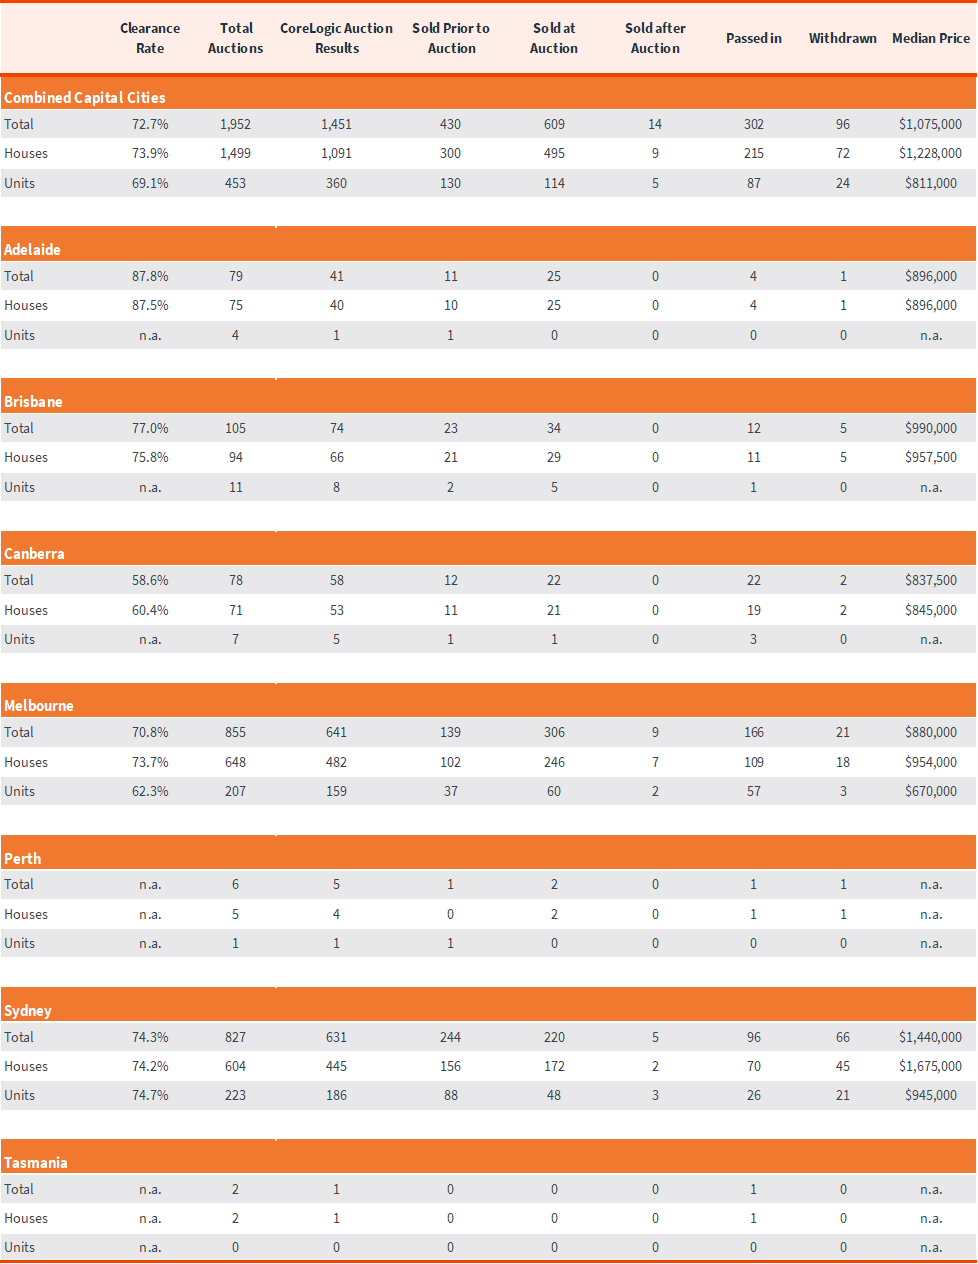
The above results are preliminary, with ‘final’ auction clearance rates published each Thursday. CoreLogic, on average, collects 99% of auction results each week. Clearance rates are calculated across properties that have been taken to auction over the past week.
Sub-region auction statistics (preliminary)
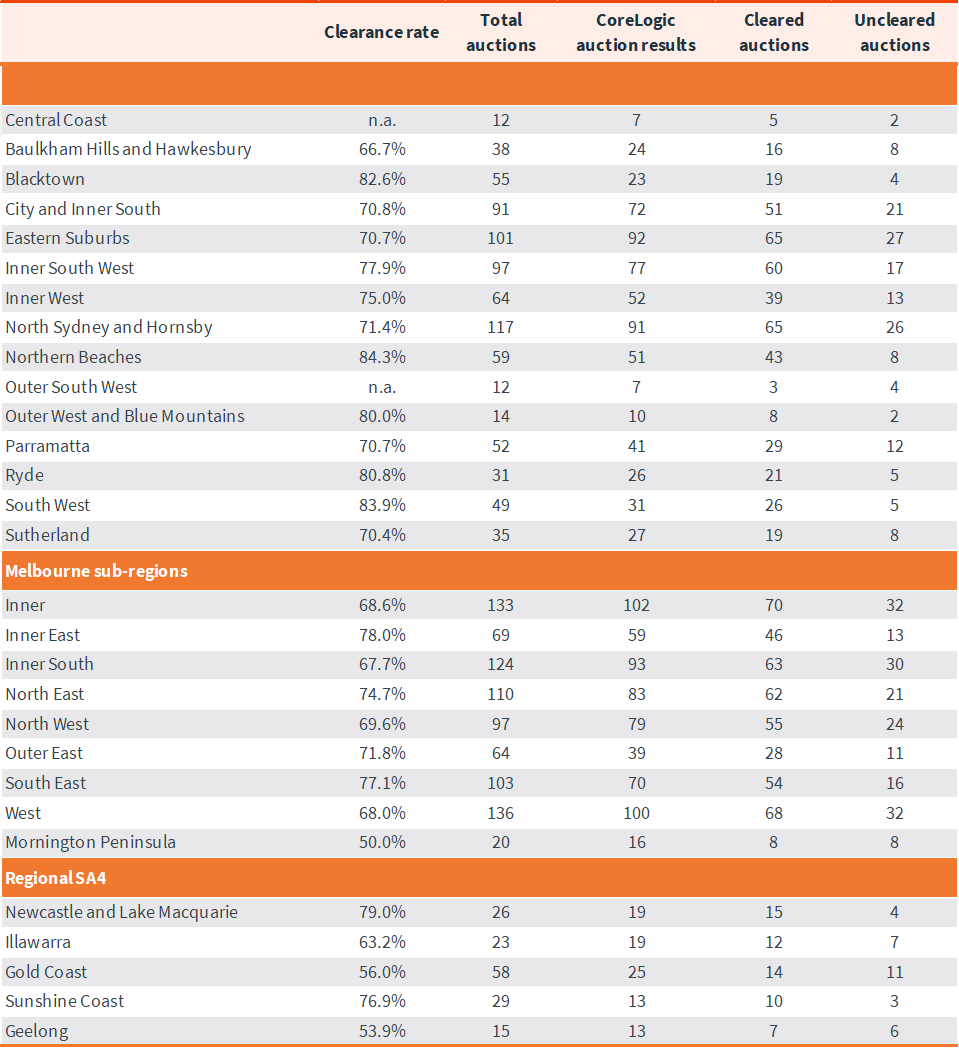
CoreLogic, on average, collects 99% of auction results each week. Clearance rates are calculated across properties that have been taken to auction over the past week.
Download Property Market Indicator Summary
