Certain economic indicators are usually telling of where the housing market is going. But through the pandemic and beyond, some data relationships fell apart, with the housing market recovery in 2023 defying high interest rates and low consumer sentiment.
This Valentine’s Day we ask: what happened to these historic relationships in data, and will they be salvaged?
Interest rates and home values
Interest rates and home values typically have an inverse relationship. Rising rates reduce borrowing capacity and demand for debt, and increase the cost of servicing a mortgage. This can contribute to a slowdown in housing demand. The opposite is true in that when interest rates are falling, prices tend to rise.
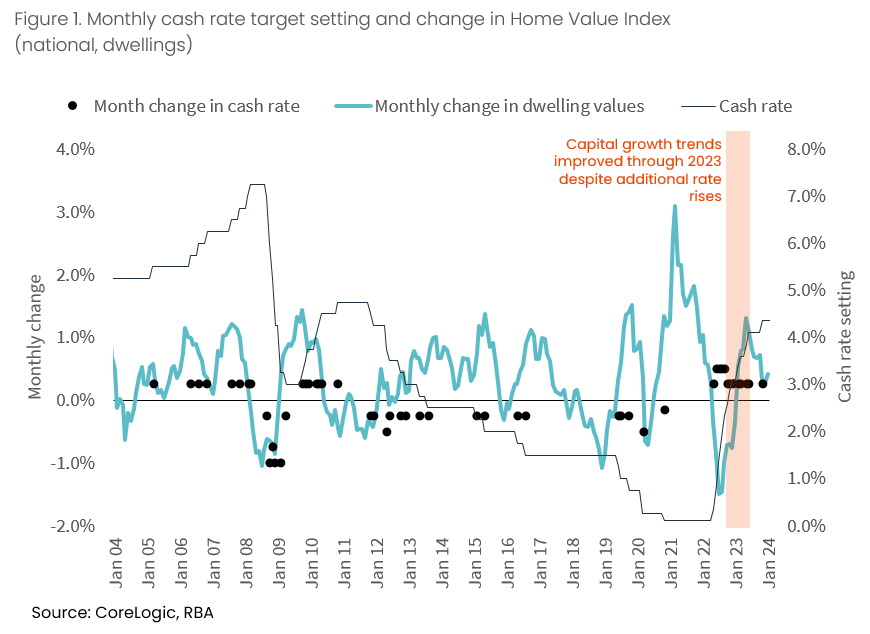
Figure 1 plots the RBA cash rate target alongside monthly changes in the CoreLogic Home Value Index. From late 2022 to mid-2023, the growth trend improves despite a record rise in the underlying cash rate.
Initially, home values had a strong reaction to rate rises, falling -7.5% between April 2022 and January 2023. However, by November last year, home values rebounded to new record highs. This coincided with five further cash rate increases in 2023.
So how was it that home values continued to rise amid increased cost of debt?
Other factors have underpinned pressure on housing values. These include a strong-bounce back in population growth from mid-2022, when international border restrictions eased and net overseas migration soared to 518,000 in the 2022-23 financial year. Tight rental markets may have also been at play, with unusually high rent growth and low vacancy rates prompting more people to purchase housing.
This is not the first time the interest rate-value growth relationship has broken down, with home values rising fairly consistently against higher cash rate settings between 2004 and 2008. This coincided with a strong economic cycle between 2004 and the start of 2007, aided by a mining boom, in which the national unemployment rate fell from 5.5% to a low of 4.2%. It also coincided with rising net overseas migration, which culminated in a pre-COVID peak of 93,462 in the March quarter of 2008.
Through 2023, some data points to buyers less reliant on housing debt participating in the market. For example, quarterly APRA data shows the portion of new housing loans secured with a 20% deposit or less shrunk from 42% in the December quarter of 2020 to 28.7% in the September quarter of 2023.
On a national level, figure 1 does show the monthly growth in values slowing from mid-2023, suggesting an extended period of high interest rates may once again be weighing on value growth.
Consumer sentiment and sales
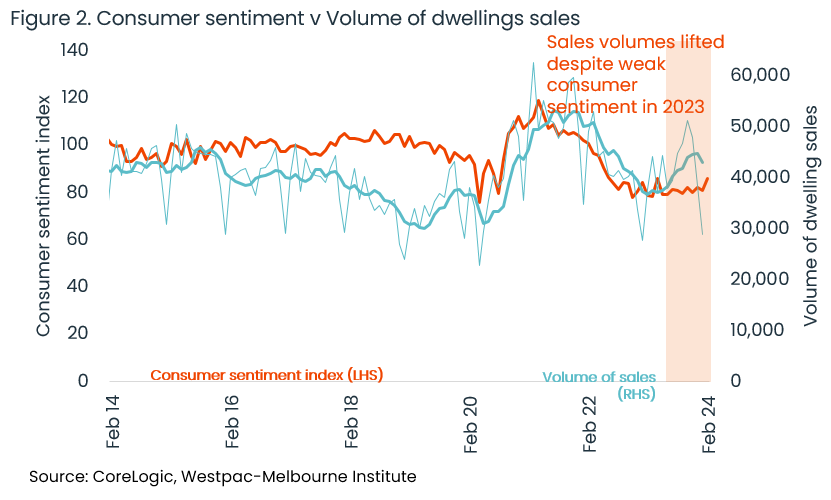
The monthly consumer sentiment index produced by Westpac and the Melbourne Institute provides a good read on how households feel about their own finances, economic conditions and demand for major purchases. A low index number indicates more pessimism, and 2023 marked the lowest average monthly reads since the early 90s recession. There was a slight rebound in the consumer sentiment index this month off the back of rates holding steady, though the index remains in pessimistic territory.
Consumer sentiment has also trended in line with dwelling sales (figure 2). However, the rolling six-month average sales volume trended higher in the second half of 2023, with monthly sales peaking at 51,302 in October. Sales volumes in the month of October 2023 were 27.6% higher on the previous year, while consumer sentiment fell -2.0% in the same period.
The departure of sales volumes from gloomy consumer sentiment reads echoes the recovery in housing values amid high interest rates. Tight rental markets, strong population growth and active buyers who are less reliant on housing credit may have played a part in pushing sales volumes higher in the spring of 2023. However, as with the monthly growth in home values slowing nationally, the end of 2023 did show a slight easing in the six-month trend of sales volumes.
The slight weakness in economic and housing data towards the end of 2023 suggests there could be a time limit on how long housing values and sales can defy high interest rates. But throughout the start of 2024, early indicators suggest market conditions are heating up again in some of the weaker capitals. For example, the final Sydney auction clearance rate was 70.6% for the week ending February 4th, the strongest result since mid-2023. Sydney home values rose 0.2% in the four weeks to February 13th, following slight declines at the end of last year. It is possible that even a perceived peak in the cash rate could provide an early boost to market conditions through 2024.


