The combined capital cities preliminary auction clearance rate rose to 72.2% last week, up from 71.1% the week prior (revised down to 62.0%). The uptick in clearance rate was accompanied by a rise in the volume of auctions, with 1,930 homes going under the hammer. This was the largest volume of auctions since the last week of June (2,030) but slightly down on the same week last year (1,973 auctions).
The past four weeks has seen an average 8 percentage point difference between the preliminary and final auction clearance rate, suggesting a clearance rate around 64% once the results are finalised.
Melbourne recorded the highest number of auctions with 840 homes taken to market. The preliminary clearance rate held just below the 70% mark (69.8%), a step up from the previous week (66.9%, revised down to 57.2%) and 50 basis points above the 8-week average.
Capital City Auction Statistics (Preliminary) – headline results
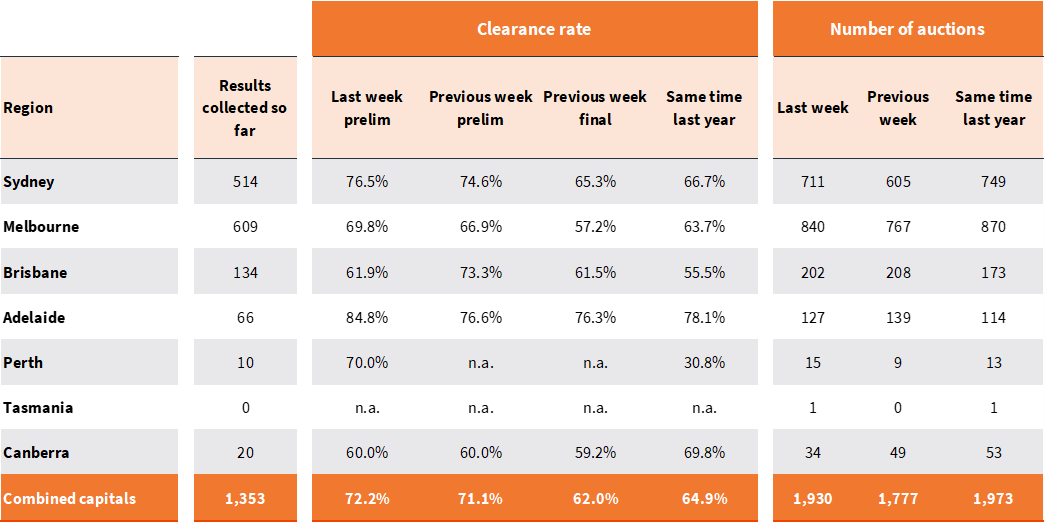
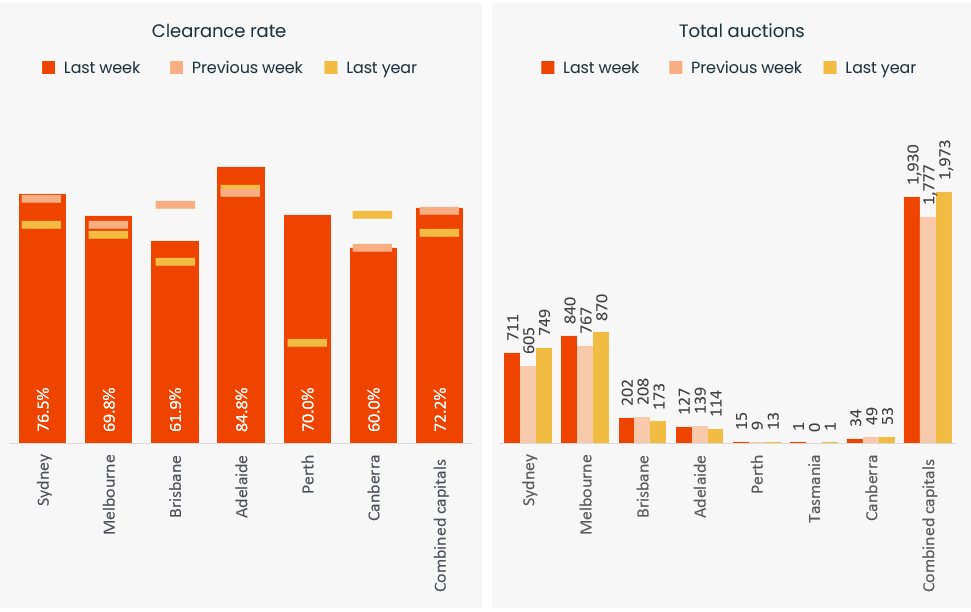
Sydney continued to record stronger auction results relative to Melbourne, with the preliminary clearance rate rising to 76.5%, up from 74.6% the week prior (revised down to 65.3% on final results). 711 auctions were held across Sydney last week, up from 605 over the previous week but lower than the same time last year (749).
Across the smaller auction markets, Adelaide recorded the highest early clearance rate at 84.8%, followed by Perth at 70.0%, Brisbane at 61.9% and ACT at 60.0%.
Capital City Auction Statistics over time
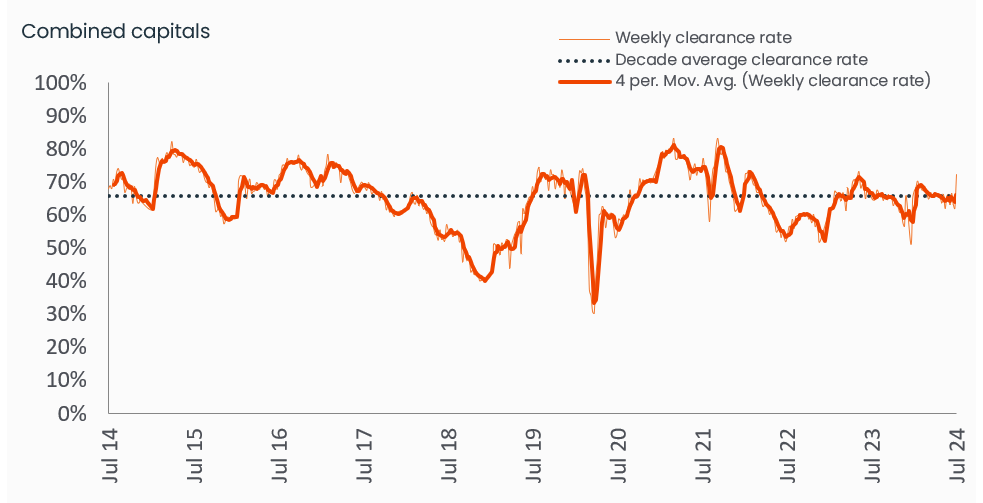

Historical clearance rates utilise the final auction clearance rate, while the current week is based on the preliminary clearance rate.
Capital City Auction Statistics (Preliminary)
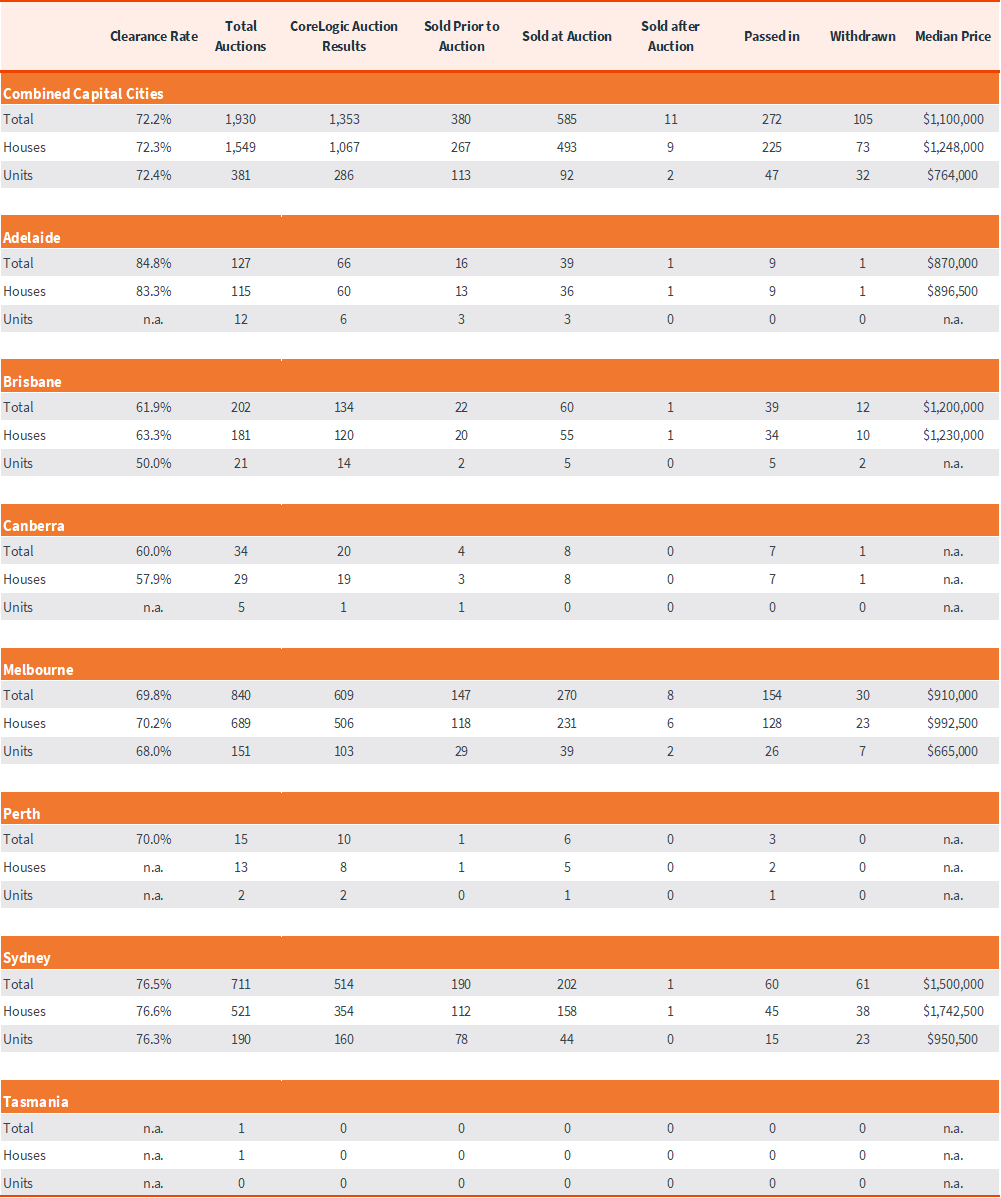
The above results are preliminary, with ‘final’ auction clearance rates published each Thursday. CoreLogic, on average, collects 99% of auction results each week. Clearance rates are calculated across properties that have been taken to auction over the past week.
Sub-region auction statistics (preliminary)
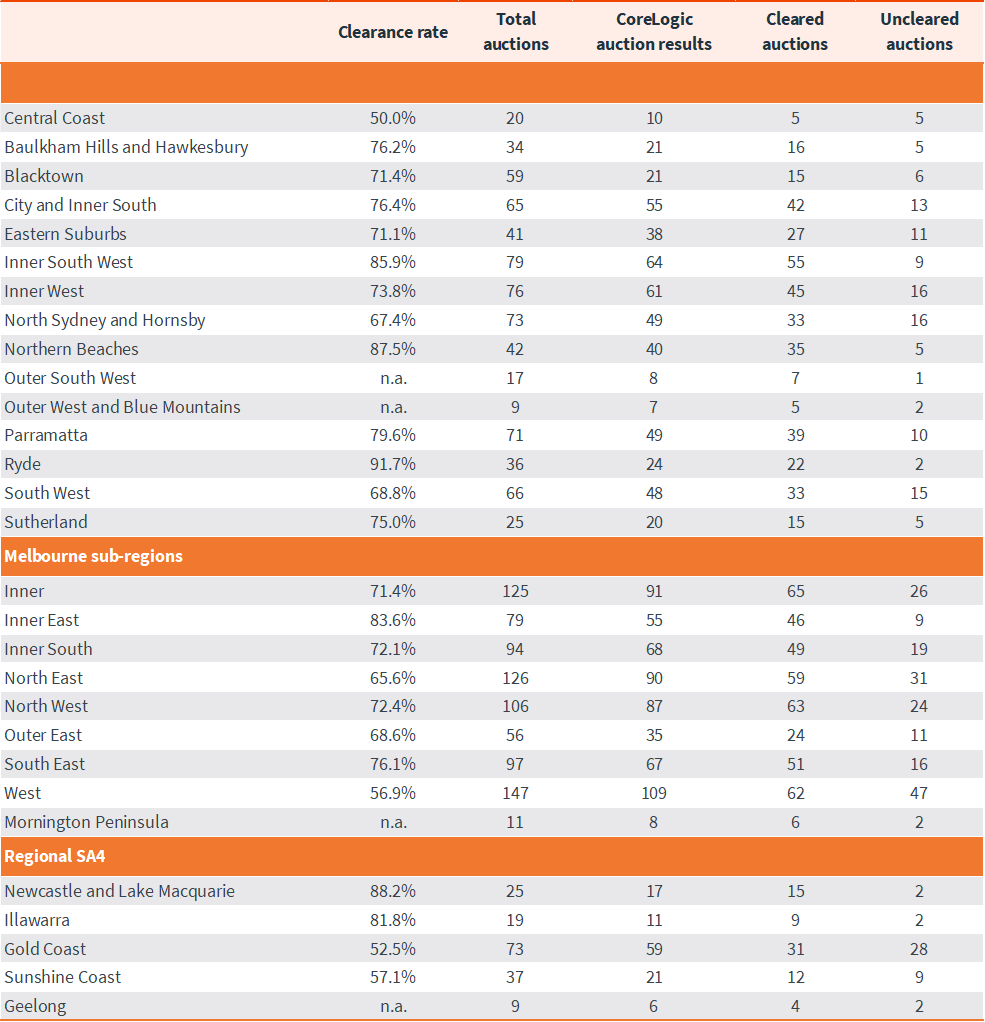
CoreLogic, on average, collects 99% of auction results each week. Clearance rates are calculated across properties that have been taken to auction over the past week.
Download Property Market Indicator Summary

Meet Caitlin Fono
Sr Associate, Research Support
Caitlin has spent more than a decade working with property data and analytics in various roles, earning a position on the CoreLogic research team in 2013. As a respected and highly experienced research analyst, Caitlin works with high frequency data sets, regularly updating our widely read auction reporting, weekly activity updates and customised data briefs.
Full profile