In today’s Pulse article, Head of Research Eliza Owen delves into when Australian dwellings were last sold, revealing:
- 2021 is the most common year in which properties were last sold. An estimated 549,000 homes were last sold during this year.
- Although residential real estate is considered a long-term game, CoreLogic estimates that one in five homes was only purchased within the past five years.
- Perth has the highest portion of stock sold over 2024 to date (3.2%), while Brisbane (24.6%) has seen the highest portion of stock turned over in the past five years. Hobart on the other hand, has older purchase dates with the most common purchase date in 2017.
- At a national level, home values have increased 7.6% since the end of 2021, though capital growth returns were almost double for those who bought a year later following a brief market dip in 2022.
- Mortgage rates for owner-occupied borrowers on a 30-year loan have surged 335 basis points since the end of 2021, pushing average monthly payments almost 50% higher for the many households that bought a property with a mortgage in that year.
New data from CoreLogic indicates 2021 is the most common year in which homes were last purchased, and roughly one in five Australian homes were purchased in the past five years.
A snapshot of when Australian housing stock was last bought over time is presented in Figure 1 below. Unlike an annual turnover rate, which shows the portion of stock traded in a particular year, the data shows the most recent sales date (based on the year sold) of homes as of July 2024.
Figure 1. When was the Australian housing stock purchased
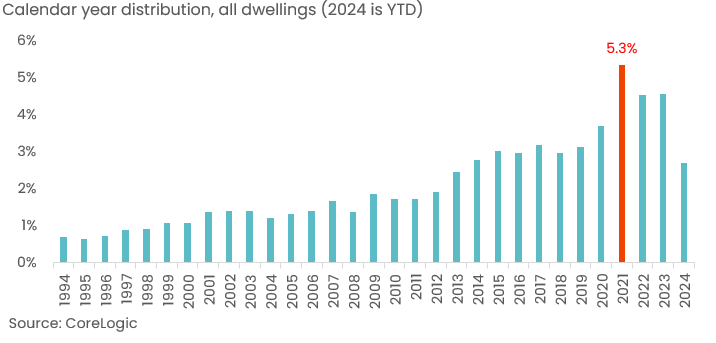
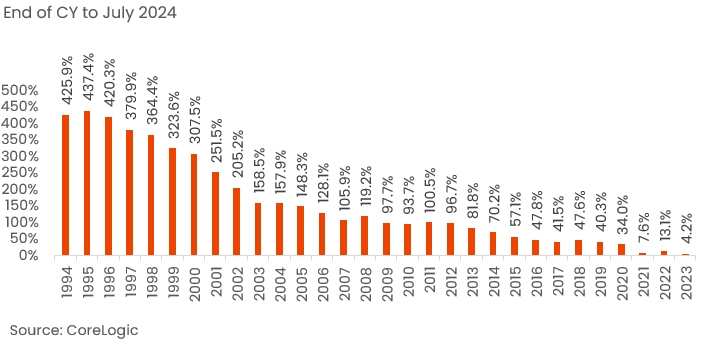
Figure 2. How much have national home values increased since year of purchase?
2021 was a popular time for people to buy and sell property, with an estimated 549,000 homes last sold during this year. It has one of the highest annual growth rates in home values on record (24.5%), mortgage rates were at a series lows (with average new owner-occupied rates bottoming out at 2.4%), consumer sentiment had moved through a decade high, and the HomeBuilder incentive was partly extended into the first four months of the year, encouraging the purchase of new homes.
Figure 3. When was housing stock last purchased? By Greater Capital City
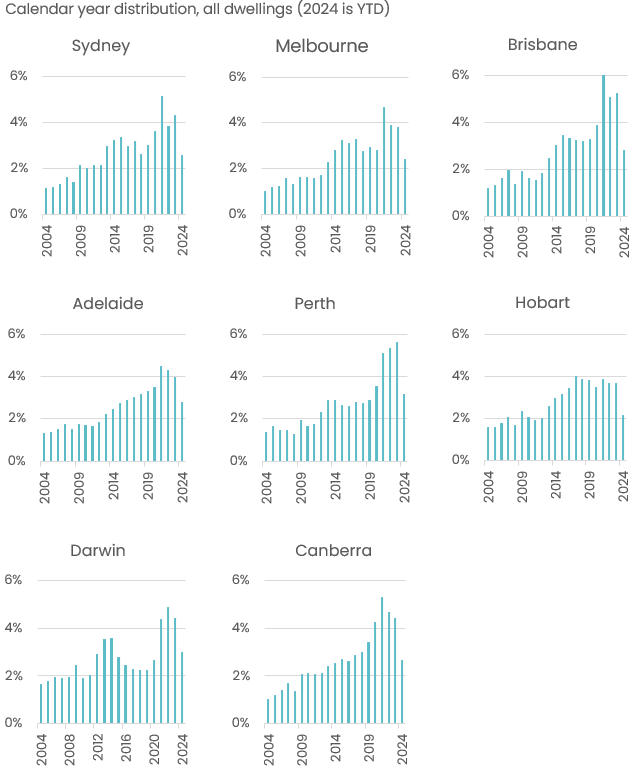
In Figure 3, the capital city charts above show that, in accordance with different capital growth conditions, the time at which homes were last sold by city varies. Perth has seen the highest portion of stock sold over 2024 to date, at 3.2%. Brisbane has seen the highest portion of stock transacted in the past five years, at 24.6%.
Hobart on the other hand, has older purchase dates. The most common last sale date in Hobart was 2017 (when 4.0% of homes were last purchased). Those who bought in 2017 are likely to have seen an increase in the value of their home, with CoreLogic’s home value index for Hobart rising 45.7% between December 2017 and July this year. However, the index is currently back to around July 2021 levels, suggesting risk of some value loss for the 11.5% of homes last purchased in Hobart since then.
At a national level, home values have increased 7.6% since the end of 2021, which is not as strong as the returns for those that bought a year later, when market values saw a short, sharp dip in response to rising interest rates, before rebounding to new record highs. Additionally, average mortgage rates for outstanding owner-occupied borrowers at the end of 2021 have increased 335 basis points, implying greater sticker shock on monthly mortgage payments, which on average will have increased by almost 50% since the purchase date1.
One could argue then that the many Australians who purchased in 2021 were incentivised into the market at a higher-risk time. Average loan sizes reported by the ABS escalated quickly (up almost 18% over the year), and buying close to the market peak means there may be higher risk of low capital returns or value loss in the face of higher debt costs. Since December 2021, home values have risen a more subdued 1.8% across Sydney and are down -4.1% in Melbourne.
However, it is likely most recent home buyers are coping with the stark change in mortgage rates and economic conditions. In the March Financial Stability Review, the RBA reported around 1% of home loans were in negative equity, and APRA reported just 1.6% of housing loans had mortgage repayments that were past due. Loan to valuation ratios for new mortgages generally trended lower through 2021, and over 90% of borrowers had at least a 10% deposit for new loans secured that year, providing a buffer against falling home values.
Based on annualised sales over the past three months to July, it is estimated that 4.9% of stock could be sold in 2024. Buyers in 2024 may not see a strong capital growth return in the short term, but mortgage serviceability is likely to become more manageable over time, with consensus pointing to a decline in the cash rate through 2025 alongside income growth. Whether turnover rates will pick up in 2025 is uncertain. While a loosening in monetary policy should help to boost confidence and lift borrowing capacity, affordability constraints are likely to remain as a barrier to home purchasing, especially for those who have found it hard to save amid the recent history of high cost of living pressures.
1Based on monthly payments for a 30 year loan term, and a 335 basis point increase on a new loan taken out in 2021 at 2.4% pa.

Meet Eliza Owen
Head of Residential Research Australia
Eliza Owen was appointed the Head of Research at CoreLogic Australia in 2020.
Full profile