In today's Pulse, Economist Kaytlin Ezzy discusses the recent slowdown in housing value growth nationally.
- National HVI growth has eased through the month, from 0.7% to 0.5%, with stubbornly high inflation and rising stock levels weighing on demand.
- The recent slowdown is notably stronger across more expensive markets and property types with house values and values in Sydney recording the most noticeable easing.
- Melbourne and Hobart are the only capitals recording falling values, with high stock levels placing downside pressure on values.
- Mid-sized capitals which have been leading growth are starting to see early signs of waning demand as affordability worsens.
The winter chills are driving temperatures lower across the country, but the thermometer is not the only thing that has been dropping. CoreLogic’s daily home value index has seen a marked easing in the rolling four week change, with national values rising just 0.5% over the four weeks to 18th July, down from a 0.7% rise seen the same time last month.
While sales and listing activity typically show a seasonal easing through winter, the trend in housing values hasn't historically displayed seasonal behaviour. Instead the recent easing in growth has likely been linked to persistently low consumer sentiment amid stubbornly high inflation and a rise in advertised stock levels in some markets.
Throughout the year so far, housing values have been buoyed by low listing levels along with the expectation of rate cuts later this year. However, with the monthly CPI figures for April and May coming in higher than anticipated, the expected timing for the first-rate cut has been pushed back by some economists, and consumers are becoming resigned to the fact that interest rates could remain higher for longer.
With many household budgets already stretched by the high cost of living and increased debt servicing costs, it's likely some potential buyers are holding off and delaying purchasing decisions until the outlook for interest rates becomes clearer, which has reduced demand and taken some heat out of the market.
Figure 1. National rolling 28-day change in CoreLogic daily HVI as at July 18 2024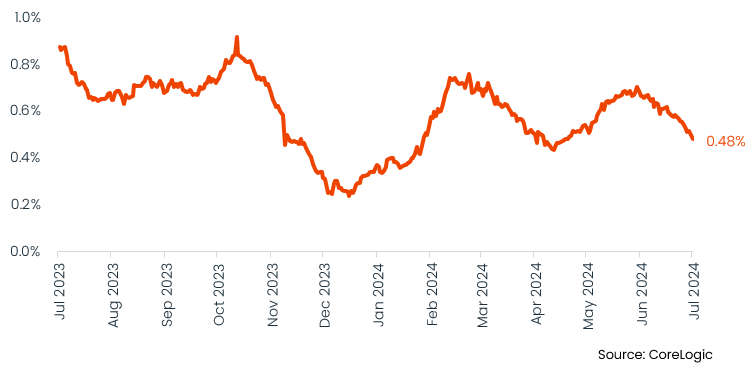
Additionally, the flow of new listings has held between 5 and 10% above the previous five-year average since April, allowing overall stock levels to accumulate, reducing buyer urgency, and providing buyers more options and more leverage at the negotiation table.
Over the four weeks to 14th July, approximately 137,000 properties were advertised for sale nationally, around -17% fewer listings than typically seen this time of year. While still below the previous five-year average, there has been a steady rise from the listing levels seen in March, when advertised supply was approximately -23% below average.
Breaking down the daily index by capital city and property type, the recent slowdown is more apparent in the more expensive sectors, with house growth showing more sensitivity than units and Sydney dwellings showing a more developed deceleration than the more affordable mid-sized capitals.
Figure 2. 28 day change in capital city values by property type as at July 18 2024
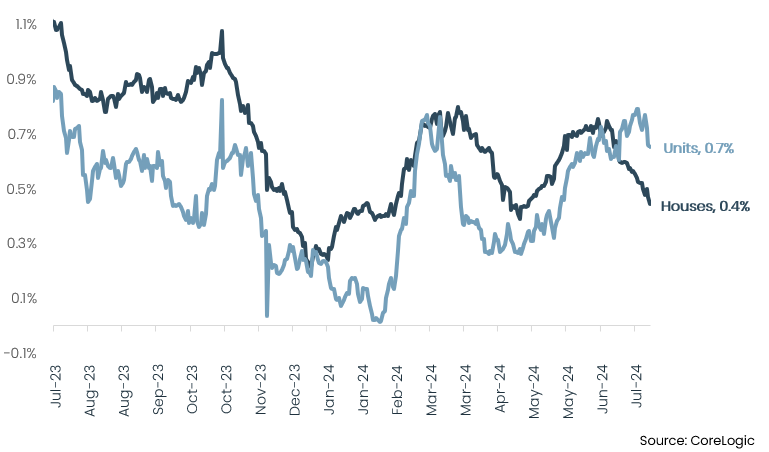
As of 18th July, the 28-day change in capital city house values has eased to just 0.4% down from 0.7% the same time last month, while unit growth has held relatively steady at around 0.7%. Similarly, Sydney dwellings have seen a more substantial easing in recent growth compared to the more affordable capitals, with the 28-day change cooling to 0.3%, down from 0.7% at the same time last month.
Affordability continues to be an important determiner for the pace of growth, with the more affordable end of the market showing more resilience to the elevated interest rate environment. Markets with lower price points are likely to be seeing a deflection of demand from the middle-to-higher end of the market as borrowing capacity reduces and affordability pressures bite.
Since the first rate hike in May 2022, the average new mortgage repayment for Sydneysiders has increased by approximately $2,200 per month*, adding significant pressure to household budgets already stressed by high cost of living pressures. It's unsurprising the potential for mortgage rates to stay higher for longer has dampened some buyers’ appetites, and we could see value growth ease further as affordability challenges and low sentiment continues to weigh on demand.
After recording a mild gain in June (0.1%) Hobart's 28-day trend has dipped back into negative territory, joining Melbourne as the only capitals recording declining values.
Figure 3. 28 day change in dwelling values – major capitals as at July 18 2024
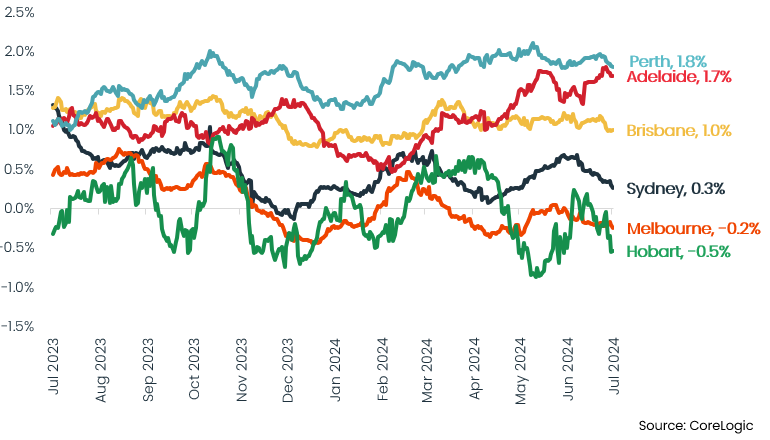
Down -0.2% and -0.5% respectively of the past four weeks, values across Melbourne and Hobart have been weighed down by high levels of advertised supply. While the remaining capitals have seen total advertised supply well below average, stock levels across both cities are currently above average, up approximately 13% and 53% on the previous five year average respectively, placing downside pressure on values.
Across the midsized capitals, Perth continues to lead the pack, with a rolling 28-day increase of 1.8%, followed by Adelaide (1.7%) and Brisbane (1.0%). While the trend for softer growth is less apparent in these cities, the change in the daily HVI has ticked lower through the first half of the month, hinting we could be seeing the first signs of waning demand.
The mid-sized capitals have been the star performers in terms of growth throughout the year to date, with Brisbane and Adelaide recording monthly growth in excess of 1% and Perth over 2% for the past three months. However, the sustained run of growth has arguably degraded these cities' relative affordability.
While these markets will likely continue to outperform markets like Sydney and Melbourne in the near term, as these cities' affordability advantage erodes, we'll likely see a further easing in demand amid persistently high borrowing costs.
Despite the easing in the pace of growth, outside of a few exceptions, we are still recording positive capital appreciation across most markets, and the fundamental supply and demand mismatch continues to support value growth.
In the meantime, all eyes will be in the June quarter inflation outcome, released on July 31. While inflation remain stubbornly above target sentiment is likely to remain low and the risk of an extended period of high interest rates could see the pace of growth in home values soften or turn negative. So far, most households have been stoic, shouldering additional borrowing costs with mortgage arrears, although rising, remaining around average.
Although rates remaining higher for longer could erode housing demand, its likely values will broadly continue to rise, albeit at a slower pace and with significant diversity from city to city and region to region. CoreLogic will be releasing the full set of monthly indices, including rental market performance for July on August 1st.

Meet Kaytlin Ezzy
Economist
Kaytlin Ezzy is an Economist at CoreLogic, Australia’s leading property data, information, analytics and services provider.
Full profile