One of the most significant factors five years on from March 2020 is how housing values have changed.
Nationally, home values have been on a roller coaster ride, rising by a cumulative 38.4%, adding approximately $227,000 to the median dwelling value. For some context, the previous five-year period saw national home values rise by a much smaller 20.6%, and the five years before that the market was up just 14.7%.
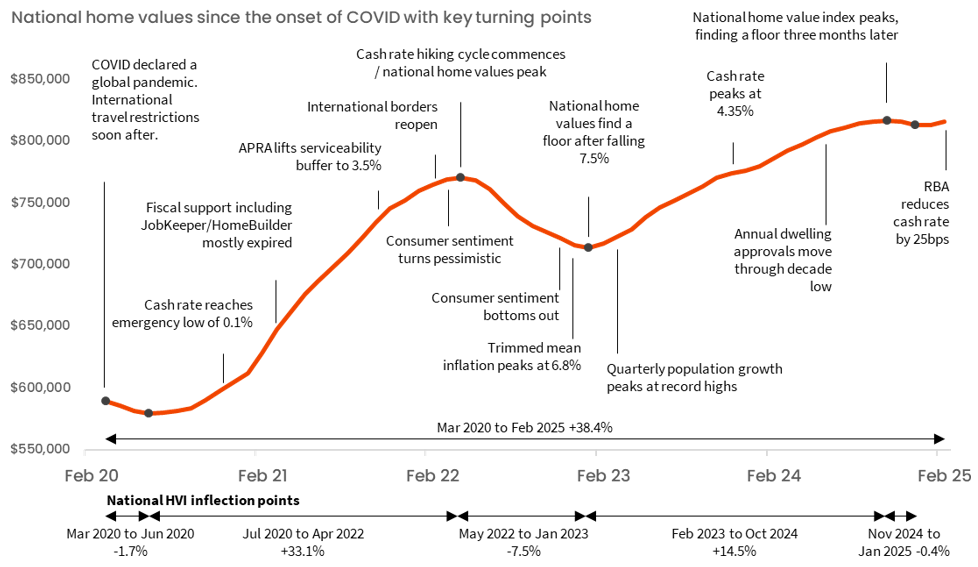
The path of growth has been far from straightforward:
- Early COVID drop. The national home value index dropped 1.7% in the early months of the pandemic but found a floor by June 2020. The temporary drop could be attributed to the initial shock of a global pandemic that was accompanied by border closures, social distancing measures and a sharp drop in consumer confidence.
- The most significant surge in values occurred between July 2020 and April 2022, with national home values jumping 33.1%. Such a rapid rate of home value growth occurred despite the absence of overseas migration. However, with significant shifts in internal migration, a drop in the average household size amplified housing demand, interest rates fell to emergency lows and a record amount of fiscal spending supported households and consumer confidence.
- The housing market moved through an interlude as interest rates started to rise, with national home values recording a short but sharp decline of 7.5% over the nine months as interest rates rocketed from record lows, sentiment plunged, and serviceability constraints bit into demand.
- Growth in home values caught a second wind from February 2023, lifting by 14.5% to the end of October 2024. This second wave of growth occurred despite high interest rates, low sentiment and affordability challenges, and very low supply.
- The most recent data shows housing values levelling off, with the national home value index edging lower by a cumulative 0.4% between November ‘24 and January ‘25 before rising 0.3% in February. This was characterised by a flat trend over the past four months as the market adjusts to normalising population growth, affordability challenges and what is likely to be a gradual and cautious rate-cutting cycle.

Meet Tim Lawless
Executive, Research Director, Asia-Pacific
Tim is executive research director of CoreLogic’s Asia–Pacific research division, managing a team of economic and data specialists across Australia and New Zealand. He brings more than 20 years’ experience to the role, providing deep insights and analysis on national housing trends.
Full profile